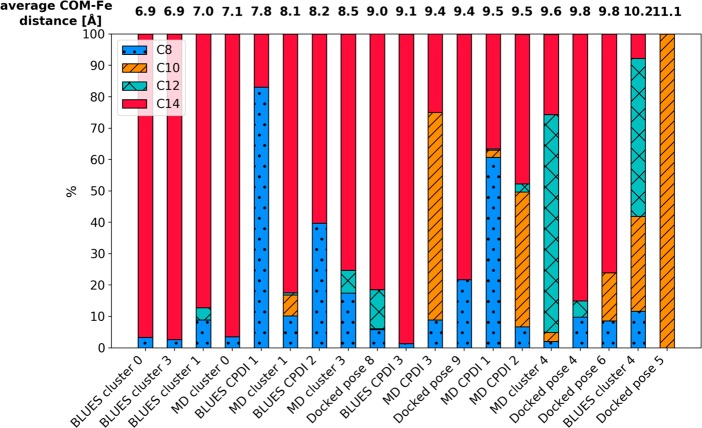
Figure 5.
Ratio of the closest SOMs to the heme iron in all simulations. The bars are ordered according to the average COM-Fe distance. We can observe an orientational change in the position where the COM-Fe distance is larger than 9 Å. The exact values and error estimates are shown in Table S7.

