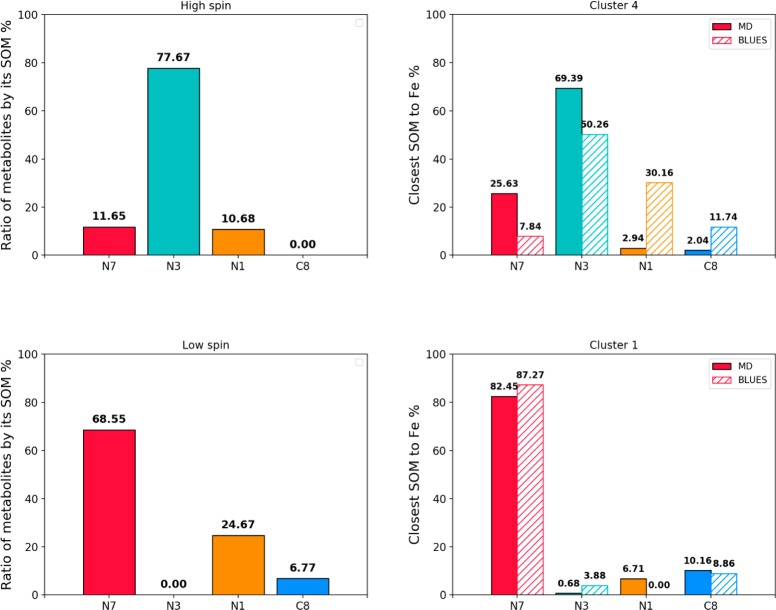
Figure 6.
(Left) Renormalized metabolite formation at different spin states, where the bars indicate which SOM has to be the closest to the heme in order for the SOM’s metabolism to take place. (Right) Percentages of the corresponding orientation of caffeine during MD (full) and BLUES (striped) simulations. The labels above bars show the percentages of corresponding orientation rounded to two decimal places.

