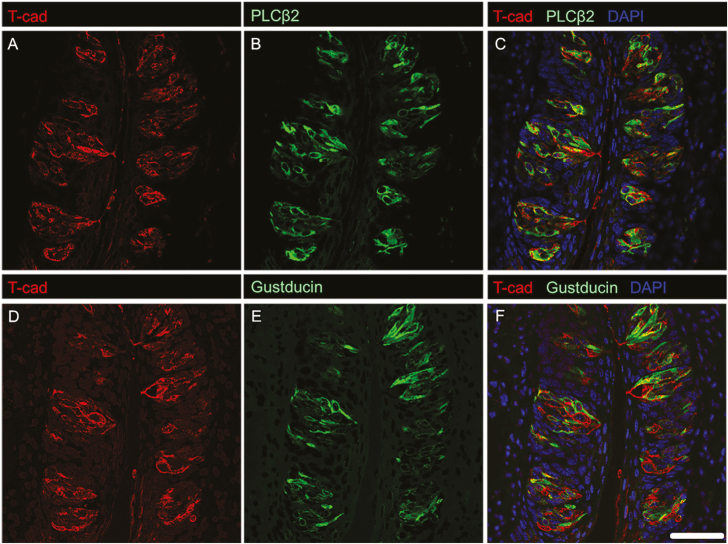
Figure 3.
IHC staining of T-cadherin with established markers for sweet-, bitter-, and/or umami-responsive TRCs. T-cadherin localizes to cells expressing PLCβ2 (C), and cells expressing gustducin (F). Single channel images of T-cadherin (A) and PLCβ2 (B) as well as T-cadherin (D) and gustducin (E) are shown for reference. Scale bar is 20 μm.

