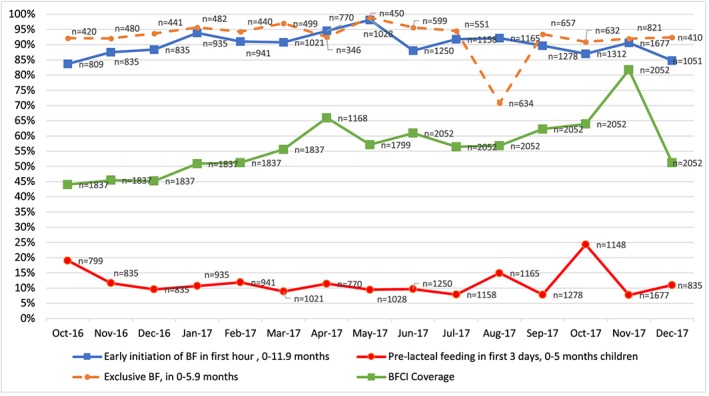
Figure 3.

Progress in breastfeeding indicators and BFCI coverage, by month, Kisumu County, October 2016 to December 2017, source: MOH BFCI monitoring data. Monthly sample sizes varied and children reached for BFCI monitoring were dependent on case load of CHVs, number of households visited, and amount of time spent per household according to number of health issues/challenges discussed. For Kisumu, additional CUs (8) were added in 2017, as BFCI was rolled out (see text for detail).
