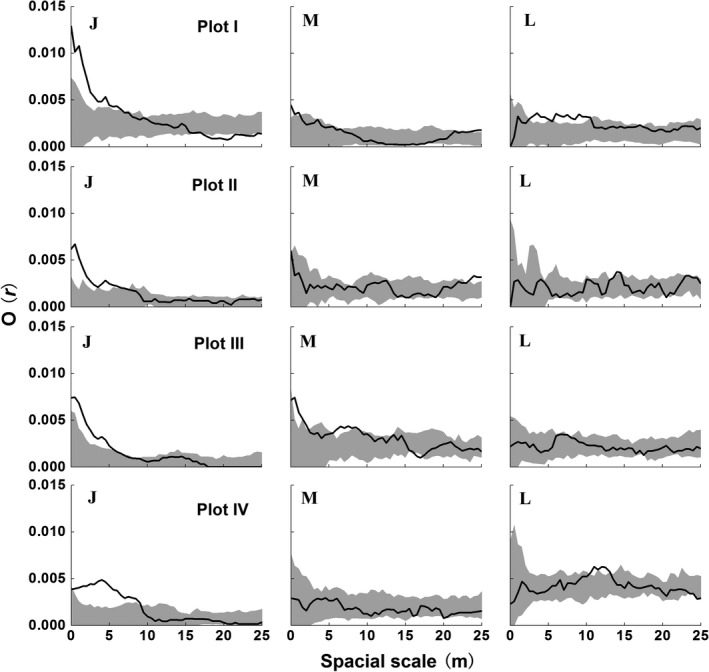
Figure 6.

Spatial distribution pattern of B. albosinensis population at different growth stages in the four Plots of the mixed forest. The solid line indicates ring statistic, O(r); the gray‐filled area indicates the upper and lower limits of the 99% confidence envelope of the null model. “J,” “M,” and “L” represent juvenile, medium‐sized, and large‐sized trees, respectively
