
Figure 2.
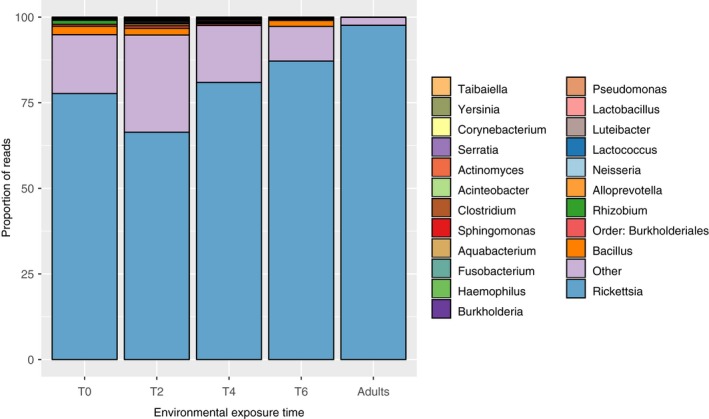
Ixodes pacificus microbiome composition after sequence quality filtering. Each of the 5 vertical bars represents an averaged microbiome for samples from that treatment. Each color represents a different OTU present in the microbiome, shown here at the genus level, and the heights of each bar represent the proportion of reads attributed to that OTU. The “Other” category represents all OTUs which did not meet the criteria of presence in at least one sample at ≥1% relative abundance. For similar community composition barplots with genera pooled at a higher level, see Appendix Figure S8