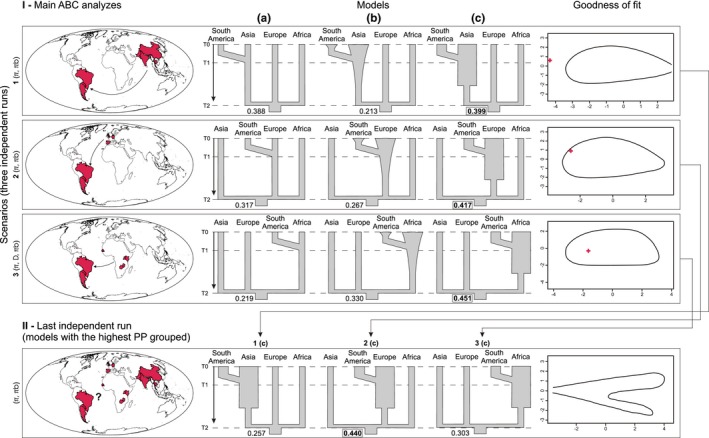
Figure 2.

An ABC analysis performed to investigate founder effect in H. armigera samples from South America. I—In horizontal, three independent ABC runs of scenarios based in COI marker represent individuals coming from (1) Asia; (2) Europe, and (3) Africa. Arrows represent time into past, T0 = present, T1 = divergence time, and T2 = coalescent time. Summary statistics vector most informative for the data are between parentheses. In vertical and inside each scenario, three models illustrate (a) constant population size; (b) exponential population growth, and (c) very rapid population expansion. Numbers at the bottom of the graph correspond to posterior probabilities (PP) while bold numbers inside the rectangle represent the highest PP found in each scenario. The goodness of fit test of the scenarios is shown on the right; Red cross: observed SuSt. II—Last independent ABC run for the scenarios comparison containing the best models obtained before (1c, 2c, 3c)
