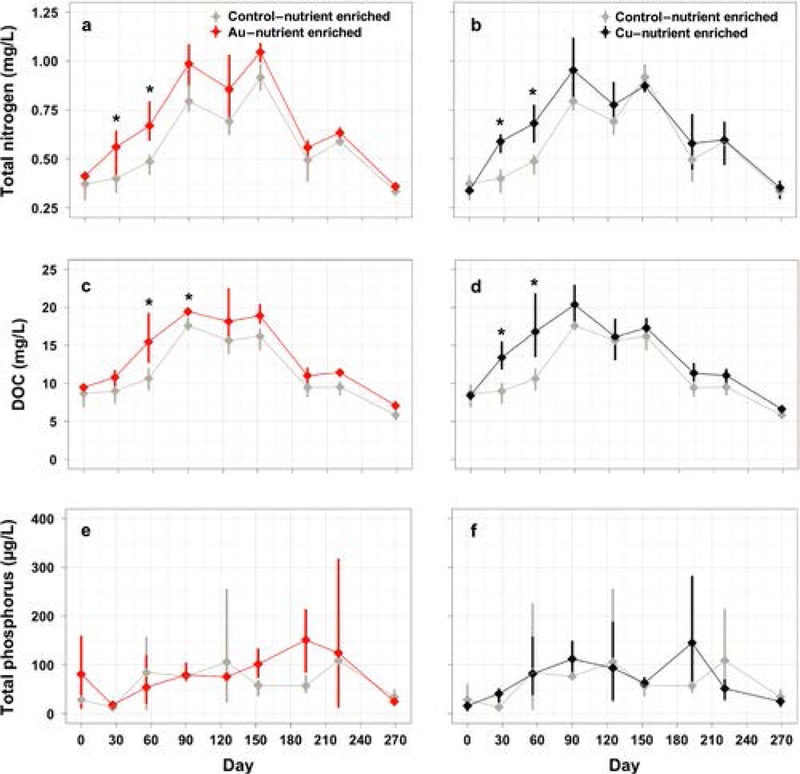
Fig. 1.

Total nitrogen (a, b), dissolved organic carbon (c, d), total phosphorus (e, f) in the water column in the nutrient enriched treatments only. The AuNP (a, c, e) and CuNP (b, d, f) nutrient enriched treatments are displayed in different panels along with their respective control treatment means and 95% confidence intervals are presented and significant effects are indicated by asterisks.
