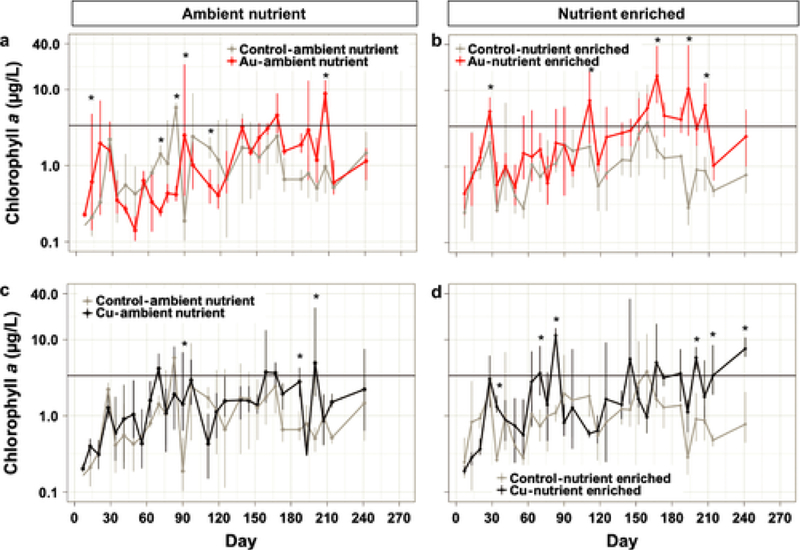
Fig. 2.

Chlorophyll a concentration on a log-scale in the surface water over the 9 months of the experiment. The different treatments are displayed in different panels along with their respective control treatment: (a) AuNP-Ambient Nutrient, (b) AuNP-Nutrient Enriched, (c) CuNP-Ambient Nutrient, (d) CuNP-Nutrient Enriched. Significant effects are indicated by an asterisk. The horizontal line represents the threshold at which a major algal bloom event was observed.
