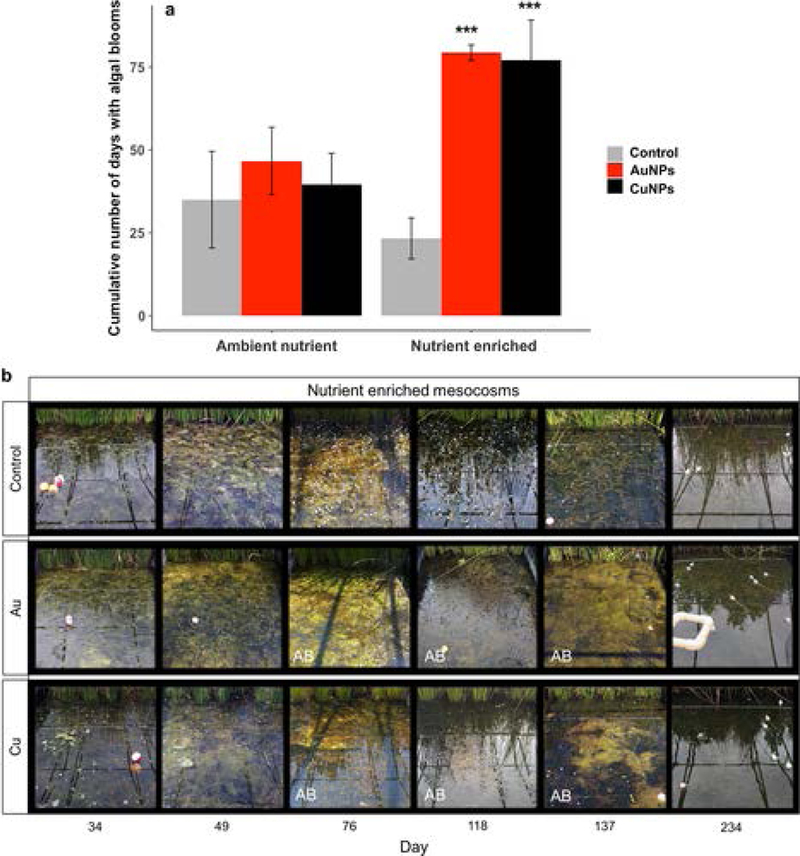
Fig. 3.

a) Cumulative number of algal bloom days in each treatment. Asterisks denote significant (P ≤ 0.001) difference between each NP treatment and the control at the same nutrient level. b) Photographs of the aquatic zone of three representative mesocosms in the Nutrient Enriched Control, AuNP and CuNP treatments at six time points during the experiment. Photographs of mesocosms experiencing a major algal bloom are indicated with the letters “AB”. The small white forms that we can observe on Day 76, 117 and 138 in the control mesocosm are Egeria densa flowers.
