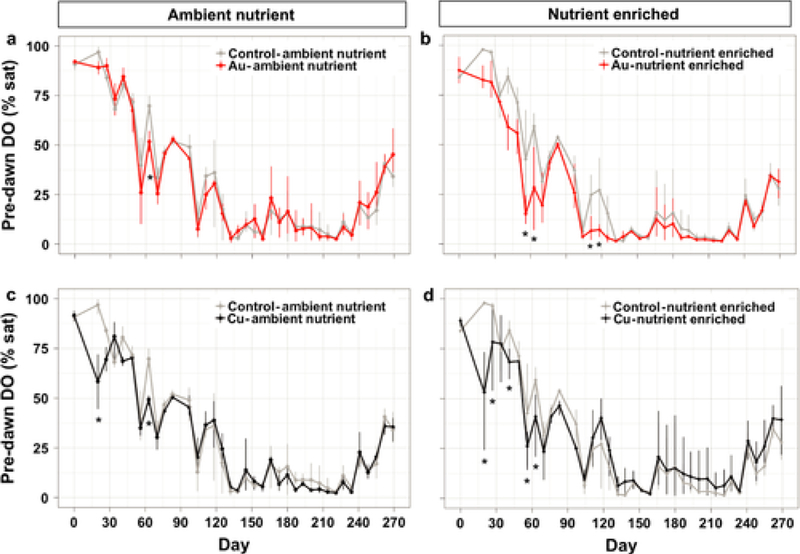
Fig. 4.

Dissolved oxygen saturation at the surface water before dawn over the 9 months of the experiment. The different treatments are displayed in different panels along with their respective control treatment: (a) in AuNP-Ambient Nutrient, (b) AuNP-Nutrient Enriched, (c) CuNP-Ambient Nutrient, (d) CuNP-Nutrient Enriched. Asterisks denote significant (P ≤ 0.05) difference between NP treatment and control of each sampling date.
