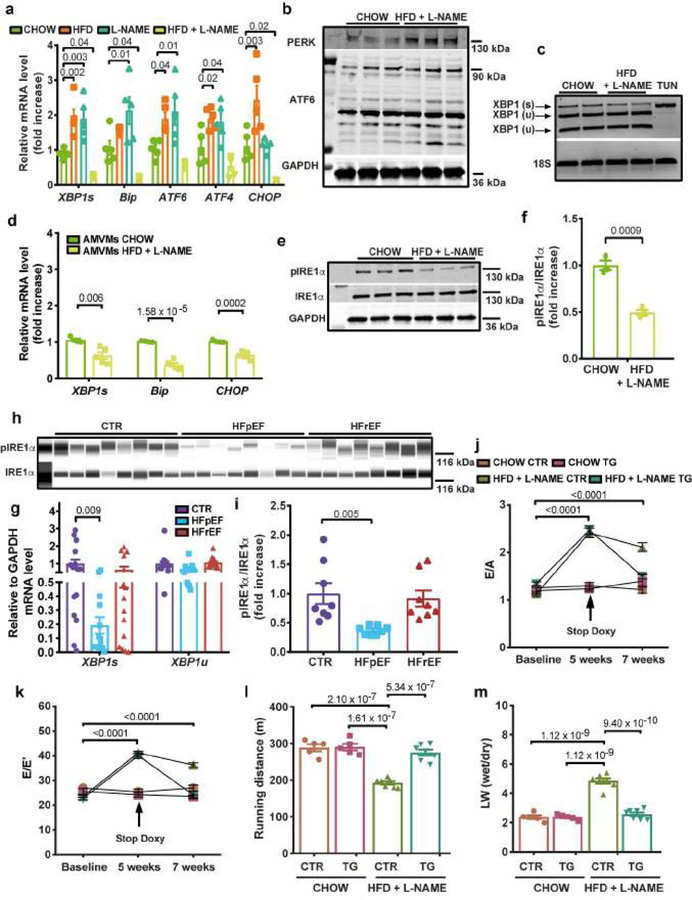
Figure 2. IRE1α-Xbp1s signaling pathway is inactive in experimental and human HFpEF and Xbp1s overexpression in cardiomyocytes ameliorates experimental HFpEF.
a, Left ventricular (LV) mRNA levels of Xbp1s, Bip, ATF6, ATF4, CHOP in mice of different experimental groups (n=5 mice per group). b, Immunoblot images of PERK, ATF6 and GAPDH proteins in LV samples of CHOW and HFD+L-NAME mice (n=3 mice per group). c, Electrophoretic analysis of spliced (s) and unspliced (u) Xbp1 transcript in LV samples of CHOW and HFD+L-NAME mice. Tunicamycin-treated neonatal rat ventricular myocytes (TUN) were used as positive control. Images are representative of three independently performed experiments with similar results. d, Adult mouse ventricular myocytes (AMVMs) mRNA levels of Xbp1s, Bip, CHOP in CHOW and HFD+L-NAME mice (n=4 mice per CHOW group; n=5 mice per HFD+L-NAME group. AMVMs were isolated from individual mice). e, Immunoblot images of LV pIRE1α, IRE1α and GAPDH proteins of CHOW and HFD+L-NAME mice (n=3 mice per group). f, Densitometric analysis ratio between pIRE1α and IRE1α protein bands (n=3 mice per group). g, mRNA levels of Xbp1s and Xbp1u in human myocardial biopsies from non-failing (CTR), HFpEF and HFrEF subjects (for CTR group n=15 subjects, for HFpEF group n=13 (Xbp1s) and n=14 (Xbp1u) subjects and for HFrEF group n=15). h, Immunoblot images of pIRE1α and IRE1α proteins in human myocardial biopsies from CTR, HFpEF and HFrEF subjects (n=8 subjects per group). i, Densitometric analysis ratio between pIRE1α and IRE1α protein bands (n=8 subjects per group). j, Ratio between mitral E wave and A wave (E/A) and k, Ratio between mitral E wave and E’ wave (E/E’) of control (CTR) and Xbp1s transgenic mice (TG) fed with CHOW or HFD+L-NAME diet over time (n=5 mice per CHOW CTR and CHOW TG groups; n=7 mice per HFD+L-NAME CTR and HFD+L-NAME TG groups. Each mouse was analyzed at all three time points). l, Running distance during exercise exhaustion test and m, Ratio between wet and dry lung weight (LW) at the end of the study (n=5 mice per CHOW CTR and CHOW TG groups; n=7 mice per HFD+L-NAME CTR and HFD+L-NAME TG groups). Results are presented as mean±S.E.M. a, g, i One-way ANOVA followed by Sidak’s multiple comparisons test. d, f, Two-tailed unpaired Student’s t-test. j-m Two-way ANOVA followed by Sidak’s multiple comparisons test. Numbers above square brackets show significant P values. For gel source data, see Supplementary Fig. 1.

