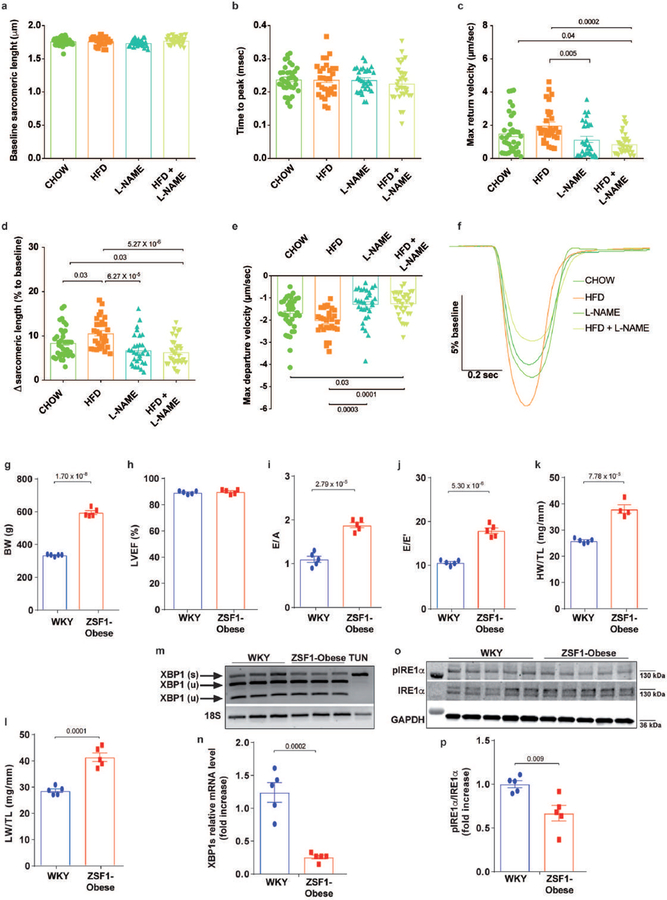
Extended Data Figure 4. Adult mouse ventricular cardiomyocyte contractility after five weeks of different dietary regimens and functional characterization and IRE1α-Xbp1s axis in ZSF1-Obese rats at twenty weeks of age.
a, Baseline sarcomeric length (n=4 mice and n=35 cells per CHOW group; n=3 mice and n=30 cells per HFD group; n=3 mice and n=30 cells per L-NAME group; n=3 mice and n=31 cells per HFD+L-NAME group). b, Time to peak (n=4 mice and n=36 cells per CHOW group; n=3 mice and n=30 cells per HFD group; n=3 mice and n=30 cells per L-NAME group; n=3 mice and n=31 cells per HFD+L-NAME group). c, Maximum return velocity (n=4 mice and n=36 cells per CHOW group; n=3 mice and n=29 cells per HFD group; n=3 mice and n=30 cells per L-NAME group; n=3 mice and n=31 cells per HFD+L-NAME group). d, Change (Δ) in sarcomeric length related to baseline (n=4 mice and n=36 cells per CHOW group; n=3 mice and n=30 cells per HFD group; n=3 mice and n=30 cells per L-NAME group; n=3 mice and n=31 cells per HFD+L-NAME group). e, Maximum departure velocity (n=4 mice and n=35 cells per CHOW group; n=3 mice and n=30 cells per HFD group; n=3 mice and n=29 cells per L-NAME group; n=3 mice and n=28 cells per HFD+L-NAME group). f, Representative tracings of cardiomyocyte contraction/relaxation during pacing. Each trace depicts one cell representative of the average for each experimental group. g, Body weigth (BW), h, Percent left ventricular ejection fraction (LVEF%), i, Ratio between mitral E wave and A wave (E/A), j, Ratio between mitral E wave and E’ wave (E/E’), k, Ratio between heart weight and tibia length (HW/TL) ratio, and l, Lung weight (LW)/TL ratio of 20-week old Wistar Kyoto (WKY) and ZSF1-Obese rats (for BW, LVEF%, E/A ratio, E/E’ ratio and LW/TL ratio n=5 rats per group; for HW/TL ratio n=5 rats per WKY group and n=4 rats per ZSF1-Obese group). m, Electrophoretic analysis of spliced (s) and unspliced (u) Xbp1 transcript in LV samples from WKY and ZSF1-Obese rats. Tunicamycin-treated neonatal rat ventricular myocytes (TUN) were used as positive control (n=3 rats per group). n, LV mRNA levels of Xbp1s from WKY and ZSF1-Obese rats (n=5 rats per group). o, Immunoblot images of pIRE1α, IRE1α and GAPDH proteins from LV samples of WKY and ZF1-Obese rats (n=5 rats per group). p, Densitometric analysis ratio between pIRE1α and IRE1α protein bands (n=5 rats per group). Results are presented as mean±S.E.M. a-e One-way ANOVA followed by Sidak’s multiple comparisons test. g-l, n, p Two-tailed unpaired Student’s t-test. Numbers above square brackets show significant P values. For gel source data, see Supplementary Fig. 1.

