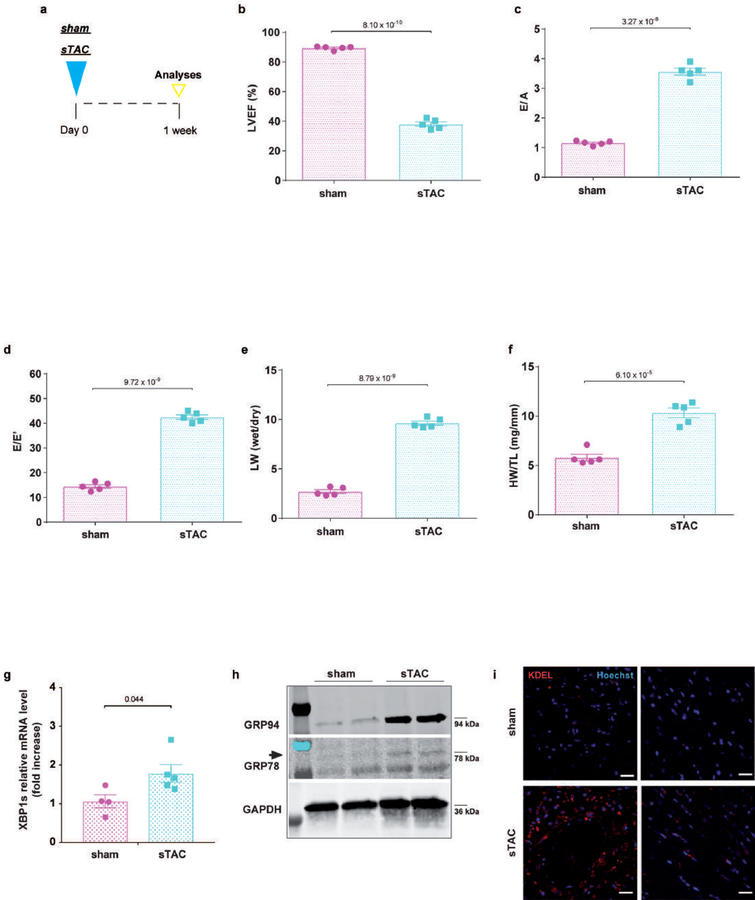
Extended Data Figure 5. Functional characterization and unfolded protein response activation in mice after one week of severe transverse aortic constriction.
a, Experimental design. C57BL/6N male mice were exposed to sham (control) or severe transverse aortic constriction (sTAC) surgery (filled triangle) and evaluated after one week (empty triangle). b, Percent left ventricular ejection fraction (LVEF%), c, Ratio between mitral E wave and A wave (E/A), d, Ratio between mitral E wave and E’ wave (E/E’), e, Ratio between wet and dry lung weight (LW) and f, Ratio between heart weight and tibia length (HW/TL) of sham control and sTAC mice (n=5 mice per group). g, LV Xbp1s mRNA level from sham and sTAC mice (n=4 mice in sham group; n=5 mice in sTAC group). h, Immunoblot images of GRP94, GRP78 and GAPDH proteins in LV samples of sham and sTAC mice. Images are representative of three independently performed experiments with similar results. Arrow indicates the regulated band. i, KDEL (Lys-Asp-Glu-Leu) sequence immunofluorescence staining in LV sections of sham and sTAC mice. Hoechst stains nuclei. Scale bars: 50 μm. Images are representative of three independently performed experiments with similar results. Results are presented as mean±S.E.M. b-g Two-tailed unpaired Student’s t-test. Numbers above square brackets show significant P values. For gel source data, see Supplementary Fig. 1.

