
Figure 4.
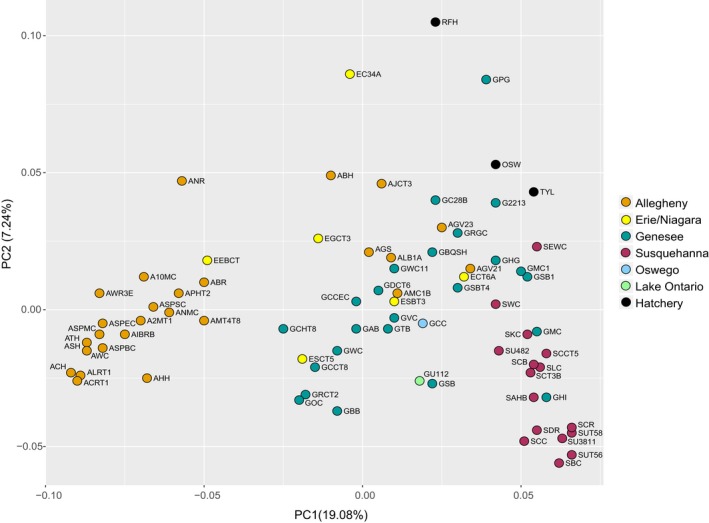
Principal coordinate analysis (PCoA) based on pairwise F ST values between Brook Trout populations in western New York State. Points are labeled with their assigned population ID, and colors denote separate drainage basins or hatchery strains