Fig. 3.

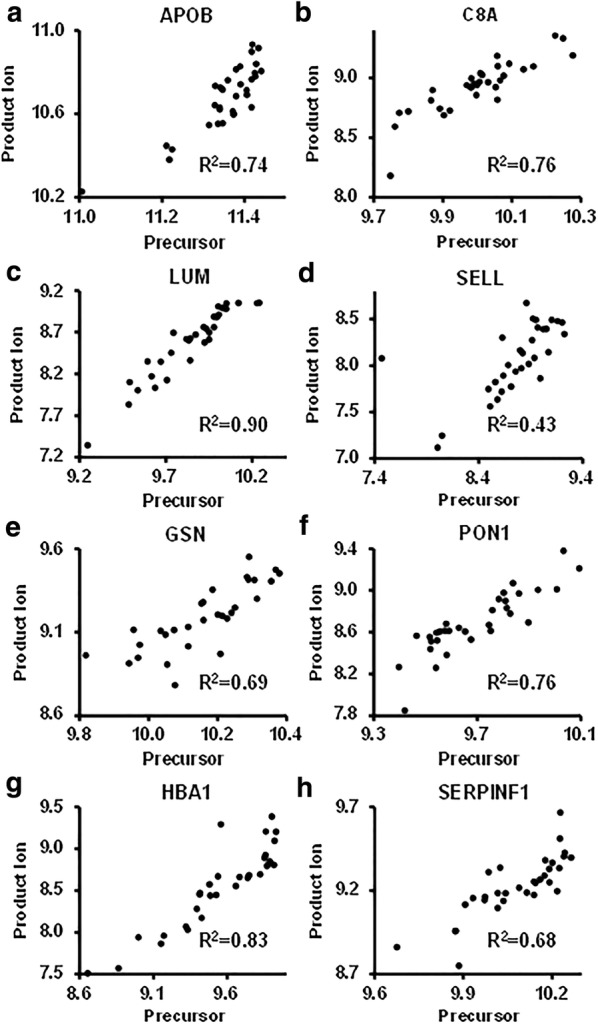
The correlation of protein intensities quantified by precursor and product ions of 8 plasma proteins. The intensities were displayed as the log10 values. a APOB. b C8A. c LUM. d SELL. e GSN. f PON1. g HBA1. h SERPINF1

The correlation of protein intensities quantified by precursor and product ions of 8 plasma proteins. The intensities were displayed as the log10 values. a APOB. b C8A. c LUM. d SELL. e GSN. f PON1. g HBA1. h SERPINF1