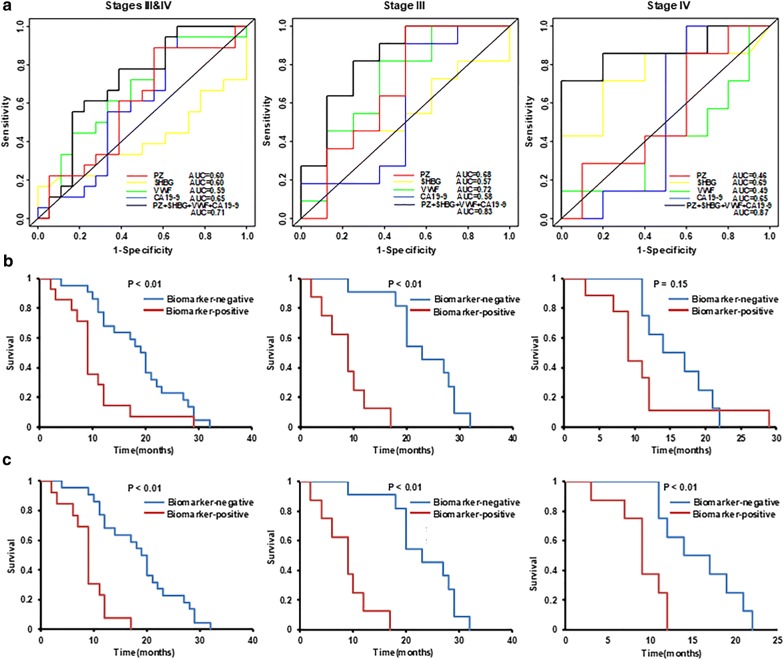
Fig. 6.
ROC and survival analysis. a ROC curves for PZ, SHBG, VWF and CA19-9 as single biomarker, as well as the best-performing composite biomarker in stages III & IV, III, and IV PDAC patients. b For all the patients included, the survival curves of PDAC patients stratified by predictive composite biomarker for stages III & IV, III, and IV PDAC patients. c After exclusion of one stage IV patient who was Good-responder, but had exceptional high VWF and CA 19-9 concentrations, the survival curves of PDAC patients were significantly improved

