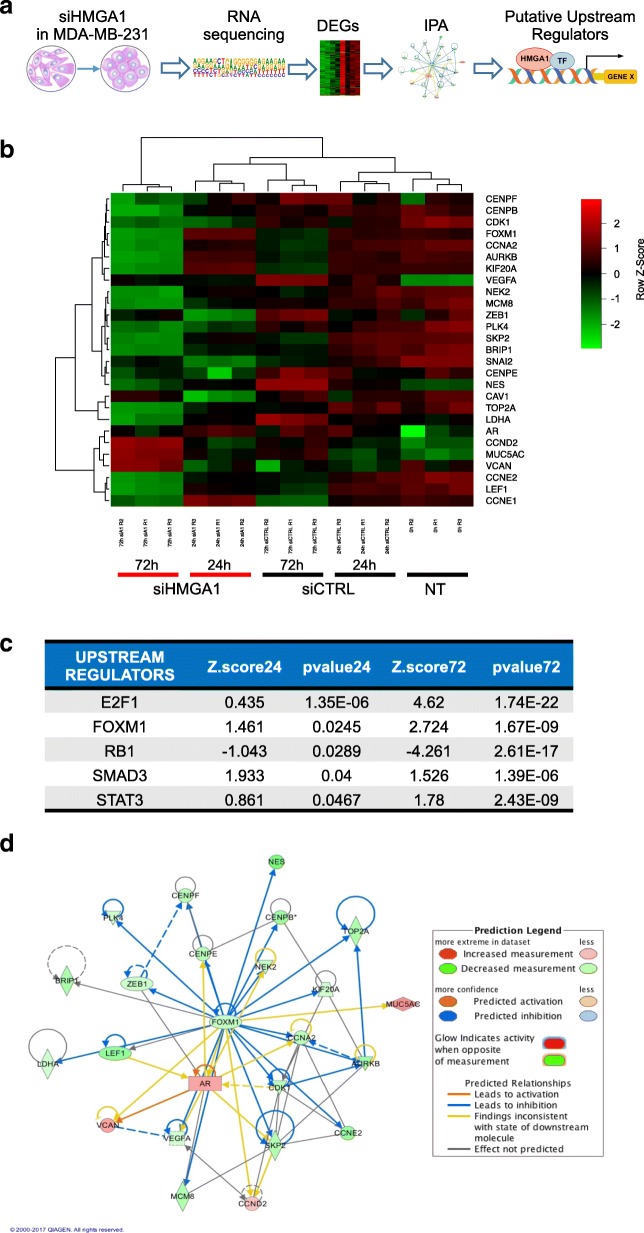
Fig. 1.
Identification of upstream regulators of HMGA1 breast cancer gene networks. a The flow-chart shows the main steps used to identify new molecular partners (TF in figure) of HMGA1, in regulating cancer-related gene networks, starting from RNA-Seq data. b Heatmap showing the expression of the top differentially expressed genes (DEGs) upon HMGA1 silencing after 24 and 72 h in MDA-MB-231 cells. Color intensity corresponds to the row Z-Score. c Pathways associated to DEGs were rebuilt by Ingenuity Software analysis. Using the Upstream regulators function (IPA suite) the transcription factors and regulative molecules of these networks were predicted. The figure shows the list of the top 5 transcription factors, putative molecular partners of HMGA1, ranked by their 24 h p-value (obtained from 24 h data). d Visual representation of Ingenuity pathway interactive-network of FOXM1. The connected-factors are found activated or inhibited by HMGA1 from RNA-Seq analysis

