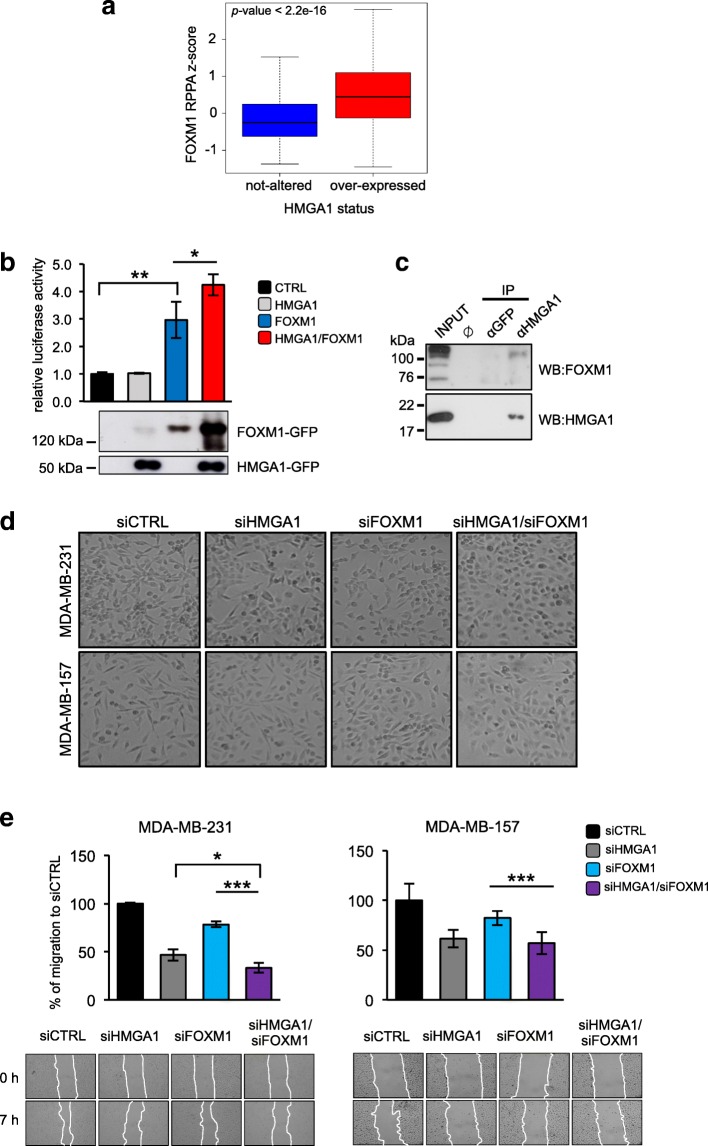
Fig. 2.
FOXM1 is a new molecular partner of HMGA1 in breast cancer progression. a Boxplots showing the FOXM1 protein levels in breast cancer patients. The samples were stratified based on HMGA1 mRNA expression levels. b HEK293T cells were transiently co-transfected with the luciferase reporter plasmid pGL3-5BS (see Additional file 5: Figure S2b for promoter reporter diagram), the expression plasmid pEGFP-HMGA1 (grey bar), pEGFP-FOXM1 (blue bar) or the combination of two (red bar). pRL-CMV Renilla luciferase expression vector was included to normalize for transfection efficiencies. Values are reported as relative luciferase activity compared to cells transfected with the expression vector pEGFP (black bar). The data are represented as the mean ± SD (n = 3); *p < 0.05, **p < 0.01; two-tailed Student’s t-test. Below the graph, representative western blot validations of HMGA1-GFP and FOXM1-GFP over-expressions are shown. c Co-immunoprecipitation (co-IP) of FOXM1 and HMGA1. The experiment was performed with either the negative control α-GFP or the α-HMGA1 antibodies on MDA-MB-231 cells lysates. Inputs (15% of the amount used for IP) and the immunoprecipitated proteins were subjected to western blot analysis with the α-HMGA1 and the α-FOXM1 (Bethyl Laboratories) antibodies. d Representative pictures of cell morphology of MDA-MB-231 (upper figures) and MDA-MB-157 (lower figures) in control condition and after HMGA1, FOXM1 and HMGA1/FOXM1 depletion (siHMGA1, siFOXM1 and siHMGA1/siFOXM1). e Wound healing assay of MDA-MB-231 and MDA-MB-157 silenced for HMGA1 and/or FOXM1. The wound areas were measured with ImageJ software and results are plotted on the graphs. The data are represented as the mean of percentage of the wound closure relative to siCTRL ±SD (n ≥ 3), *p < 0.05, ***p < 0.001; two-tailed Student’s t-test. Below the graphs, representative images of wound closure, taken at 4X magnification, are reported

