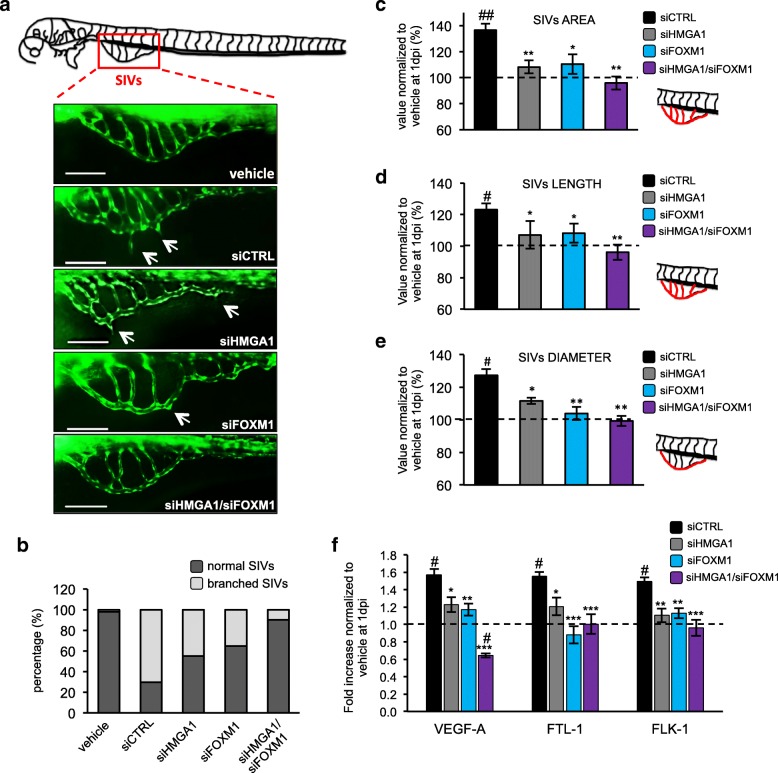
Fig. 7.
HMGA1 and FOXM1 modulate in vivo the proangiogenic activity. a Schematic representation of the sub-intestinal veins (SIVs) evaluated for the assessment of the zebrafish angiogenic process. Below, representative images of SIVs (green) taken at 1 day post injection (dpi) of MDA-MB-231 cells silenced for HMGA1 and/or FOXM1 or control cells on zebrafish Tg (fli1:EGFP)Y1 embryos. The white arrows indicate an alteration of the SIVs. The culture medium was used as a negative control. Bar = 100 μm. b Embryos with a branched SIVs (light grey) or unaltered SIVs (dark grey) were counted and plotted on the graph, expressed in percentage (n = 30). The area (c), length (d) and diameter (e) of the SIVs (schematic representation of the vessels considered for each parameter is reported on the right of the graphs and coloured in red) were measured in zebrafish embryos at 1 dpi of MDA-MB-231 cells silenced for HMGA1 (grey bar), FOXM1 (light blue bar) or co-silenced for the two factors (purple bar). The data are normalized to control (vehicle) represented as a black dotted line and are represented as the mean ± SD (n = 30). #p < 0.05, ##p < 0.01 respect to the vehicle. *p < 0.05, **p < 0.01 respect to the siCTRL. f qRT-PCR analysis of zebrafish VEGFA, FLT1 and FLK1 at 1 dpi in embryos injected with control MDA-MB-231 (black bar) or MDA-MB-231 cells silenced for HMGA1 (grey bar), FOXM1 (light blue bar) or co-silenced for the two factors (purple bar). Data were normalized to the zebrafish β-Actin mRNA amount. The data are compared to the control (vehicle) and are represented as the mean ± SD (n = 60). #p < 0.05 respect to the vehicle. *p < 0.05, **p < 0.01 and ***p < 0.001 respect to the siCTRL

