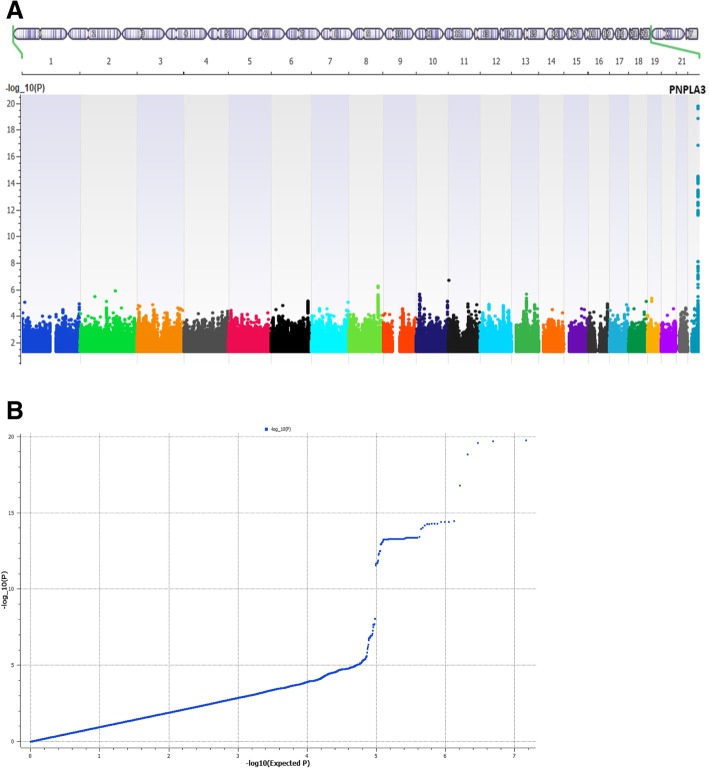
Fig. 1.
a, b Manhattan plot (a) and Q–Q plot (b) of genome-wide markers for NAFLD in European ancestry (1106 cases and 8571 controls). A total of 1106 cases of NAFLD and 8571 controls were analyzed after quality control. Logistic regression analysis was performed for 7,261,527 variants with MAF > 1% assuming an additive genetic model, adjusted for age, sex, BMI, genotyping site, and genetic ancestry (principal components 1 through 3). Results are plotted as –log10 p values on the y-axis by position in chromosome (x-axis) (NCBI build 37)

