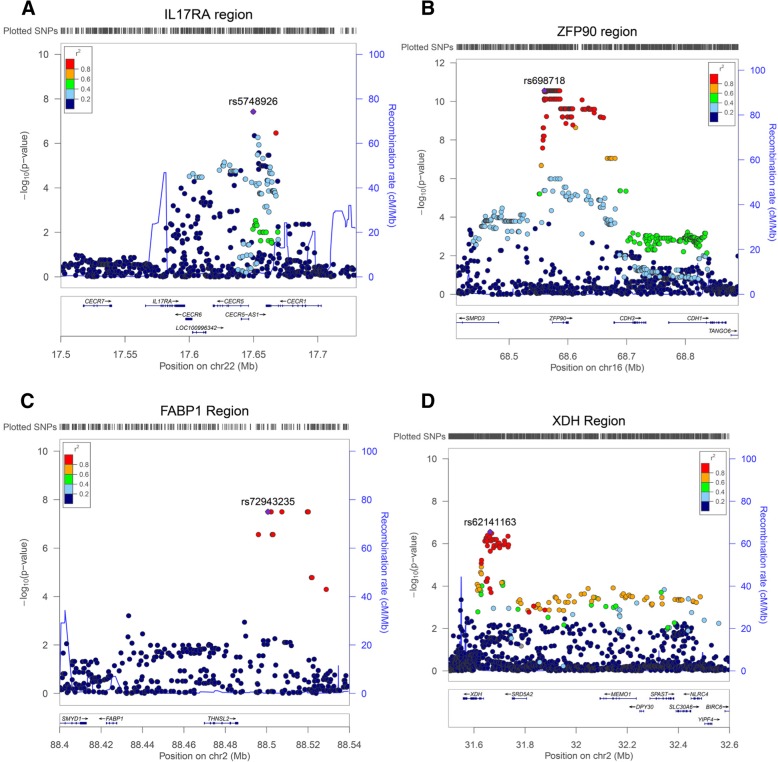
Fig. 4.
a–d Regional association plots of best effects in case-only linear regression analyses for continuous traits of NAS score, fibrosis, and ALT liver enzyme, respectively. a The best observed effect near the IL17RA region for NAS score. b The most significant effects at 16q22 near ZFP90 gene for fibrosis. c The effect near FABP1 locus for fibrosis. d An effect at 2p22 near XDH for AST liver enzyme

