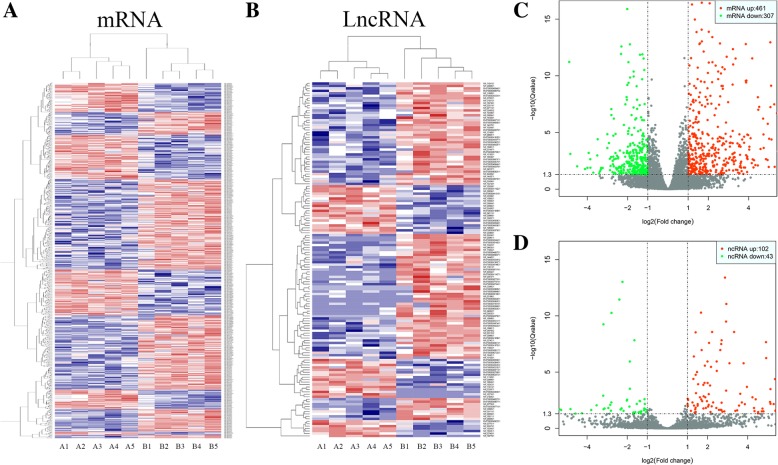
Fig. 2.
Identification of DE lncRNAs and mRNAs. a Heatmaps of DE mRNAs between the control group and the co-culture group. b Heatmaps of DE lncRNAs between the control group and the co-culture group. c Volcano plots of DE mRNAs between the control group and the co-culture group. d Volcano plots of DE lncRNAs between the control group and the co-culture group. In each heatmap, A indicates the control group (only MSCs) and B indicates the co-culture group (MSCs co-cultured with monocytes)

