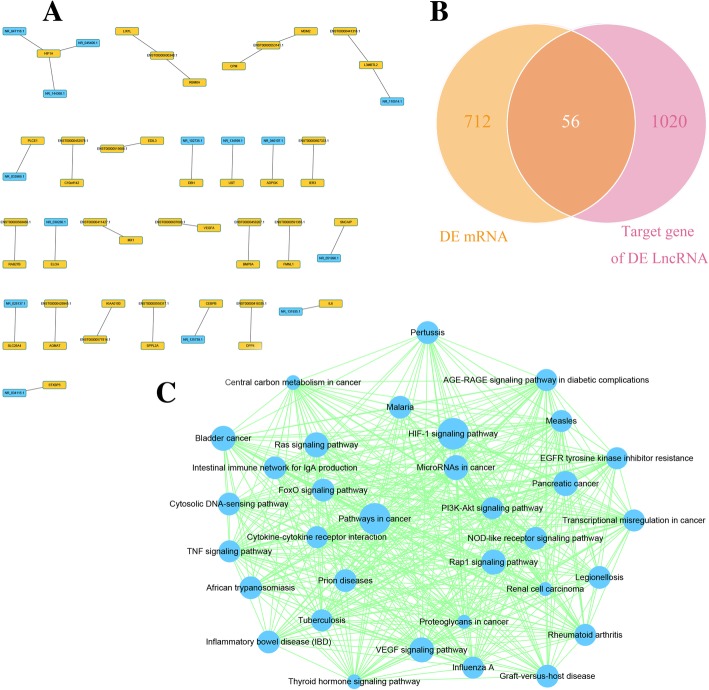
Fig. 6.
Analysis of lncRNA target mRNAs. a DE lncRNAs and their target genes with a combined score larger than 0.9 are shown. Yellow indicates upregulated genes, and blue indicates downregulated genes. b Venn diagram showing DE mRNAs and target genes of DE lncRNAs. c Target genes of DE lncRNAs were clustered using KEGG pathway analysis

