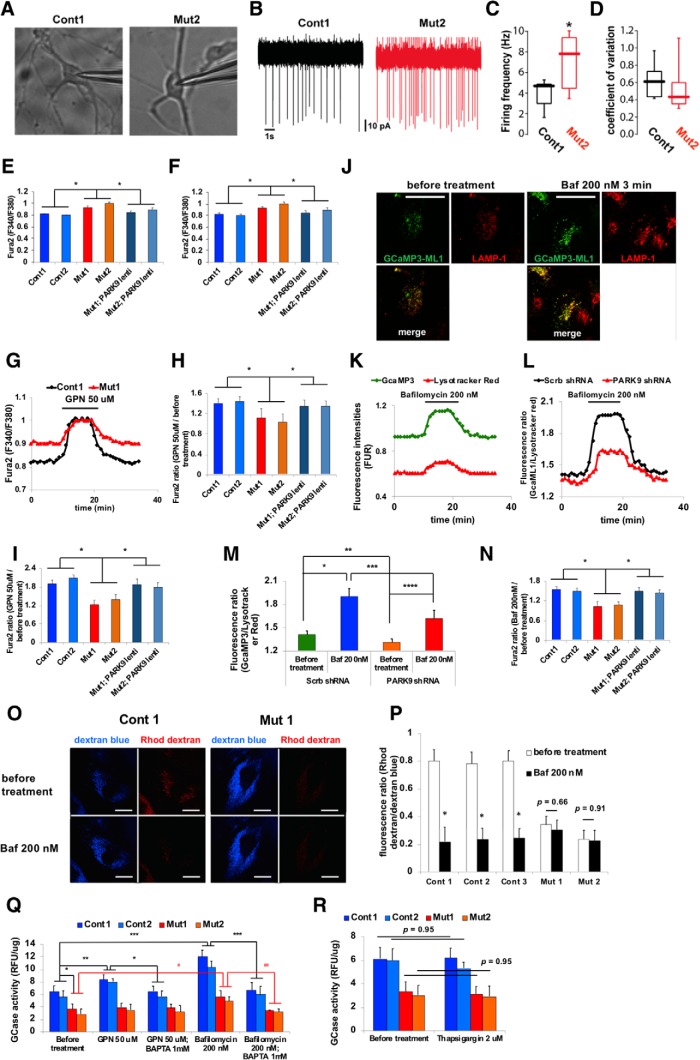
Figure 3.
PARK9 patient DA neurons exhibit dysfunctional lysosomal Ca2+ homeostasis (Figure 3-1). A–D, Spontaneous firing rate of DA neurons taken from control and PARK9 patients. A, Representative images of DA neurons from control individuals (left), PARK9 patients (right) during cell-attached patch-clamp recordings. B, Representative cell-attached recordings from control (top) and PARK9 patient-derived neurons (bottom). C, Box plots showing the distribution of spiking rates in control (n = 10) and PARK9 DA (n = 10) neurons (control median = 4.61 Hz vs PARK9 median = 7.25 Hz; *p = 0.021, unpaired t test with Welch's correction). D, Box plots showing the distribution of coefficient of variation in control (n = 10) and PARK9 DA (n = 10) neurons (control median = 6.1 vs PARK9 median = 4.2; *p = 0.1051, Mann–Whitney test). E, F, Cytosolic Ca2+ levels were measured using Fura-2 AM Ca2+ indicator. The intracellular Ca2+ concentration was measured in two control, two PARK9 mutant, and two PARK9 mutant fibroblasts that were transfected with lentivirus expressing PARK9 (Figure 3-1A) (E) and in iPSC-derived DA neurons (Figure 3-1B) (F) (n = 10, *p = 0.0001). G–I, Ca2+ release from control and PARK9 mutant fibroblasts and DA neurons. G, Change of cytosolic Ca2+ concentration by GPN treatment was monitored by Fura-2 AM fluorescence ratios at 340 nm/380 nm. H, Fura-2 AM fluorescence ratios were shown before and after GPN treatment in two controls and two PARK9 mutant fibroblasts (n = 10, *p = 0.002). I, Ca2+ release from lysosomes was decreased in PARK9 mutant DA neurons. Fura-2 AM ratios were measured before and after GPN treatment (n = 10, *p = 0.0001). J–N, Ca2+ release from lysosomes was analyzed with the lysosome targeted Ca2+ sensor GCamP3-ML1. J, Representative images of GCamp3-ML1 expressing H4 cells labeled with LAMP-1 before and after Baf1 treatment. K, GCamp3-ML1 and LysoTracker intensities were monitored during Baf1 treatment. L, Ratios of green (GCamp3-ML1) to red (LysoTracker red) fluorescence were monitored during Baf1 treatment. M, Ratios of green to red fluorescence under Baf1 treatment were analyzed in H4 cells transfected with Scrb shRNA or the shRNA against human PARK9 (n = 30–50/cells, *p = 0.0005, **p = 0.0422, ***p = 0.0303, ****p = 0.0063). N, Ratios of green to red fluorescence under Baf1 treatment were analyzed in control and PARK9 mutant fibroblasts and two PARK9 mutant fibroblasts transfected with lentivirus expressing PARK9 (Figure 3-1C). (n = 30–50/cells, *p = 0.0001). O, P, Ca2+ levels in lysosomes were measured using the Ca2+ dye rhodamine dextran. O, Representative images of control and mutant fibroblasts labeled with rhodamine dextran and Cascade blue. P, Quantification of rhodamine dextran and Cascade blue fluorescence intensities before and after Baf1 treatment in control and PARK9 mutant fibroblasts (n = 10 cells, *p = 0.0001, Student's t test). Q, Effect of PARK9 deficiency on Ca2+-dependent lysosomal exocytosis. GCase activity was measured in the media before and after 50 μm GPN or 200 nm Baf1 treatment. Treatment with the Ca2+ chelator 1,2-bis(o-aminophenoxy)ethane-N,N,N′,N′-tetraacetic acid (BAPTA) diminished the effect of GPN and Baf1 (n = 3, *p = 0.0135, **p = 0.0442, ***p = 0.0008, #p = 0.0347, ##p = 0.0023). R, Effect of Ca2+ release from the endoplasmic reticulum (ER) on lysosomal exocytosis was analyzed. GCase activity was measured from the media of two control or two PARK9 mutant fibroblasts before (left) and after 2 μm thapsigargin treatment (right) (n = 3, p = 0.95). Statistical analysis was conducted using one-way ANOVA with Tukey's post hoc test unless otherwise stated. Scale bar, 20 μm in J and O.

