
Figure 1.
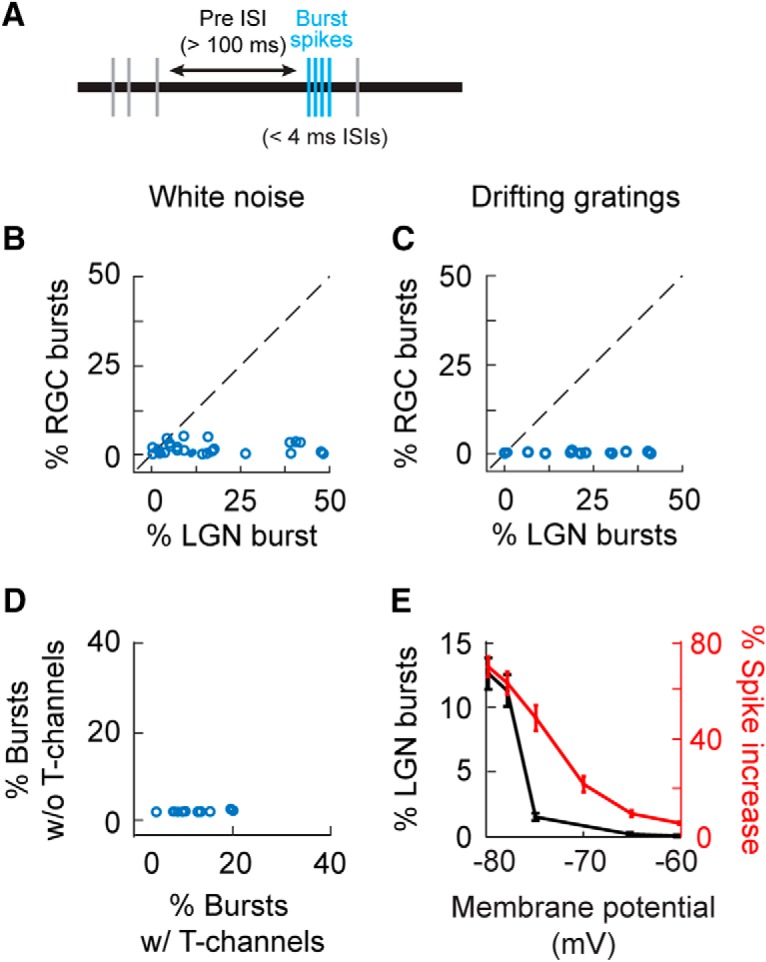
Comparison of burst frequency in the retina and LGN. A, Bursts (blue tick marks) were identified by applying the following criteria to extracellular recordings: (1) the first spike was preceded by an ISI >100 ms (horizontal arrow) and (2) subsequent spikes followed with ISIs of <4 ms. B, C, Scatterplot showing the percentage of RGC and LGN cell spikes that were identified as part of a burst, during white noise (B) and drifting grating (C) stimulation. D, Scatterplot showing the percentage of simulated LGN spikes that were identified as part of a burst when a leaky integrate-and-fire mode either included or did not include T-channels. E, Line graph showing the influence of membrane potential on the percentage of LGN spikes that were identified as part of a burst when the simulation included T-channels (left y-axis, black line) and the increase in simulated LGN spike count due to the addition of T-channels to the model (right y-axis, red line). Error bars indicate SE.