
Figure 5.
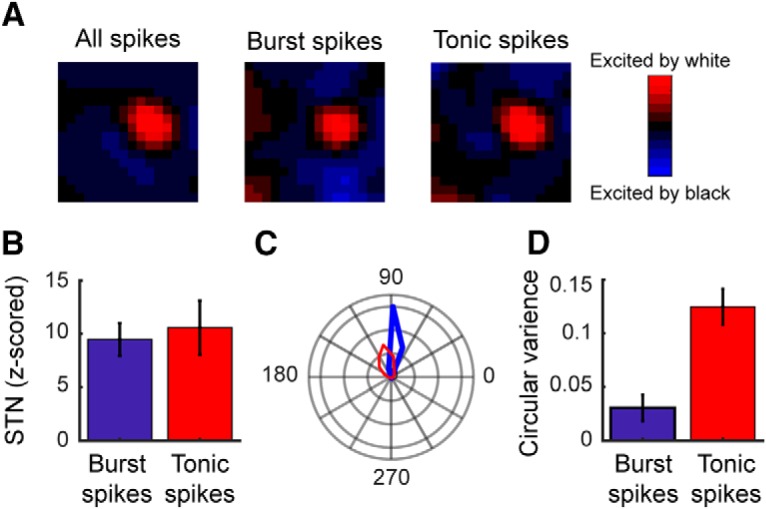
Geniculate bursts are evoked by visual stimulation. A, STRF maps from a representative LGN neuron calculated using specific subsets of spike count-matched geniculate spikes: all spikes (left), burst spikes (middle), and tonic spikes (right). B, Bar graph showing sample mean SNRs for tonic and burst STRFs. C, Polar plot illustrating the phase locking of LGN tonic (red line) and burst (blue line) spikes during visual stimulation with drifting gratings. D, Bar graph showing circular variance for tonic and burst spikes during visual stimulation with drifting gratings. Low circular variance values indicate that the spikes were phase locked to the visual stimulus, while a value of 1 indicates that the spikes occurred equally across all phases. Error bars indicate SE.