
Figure 8.
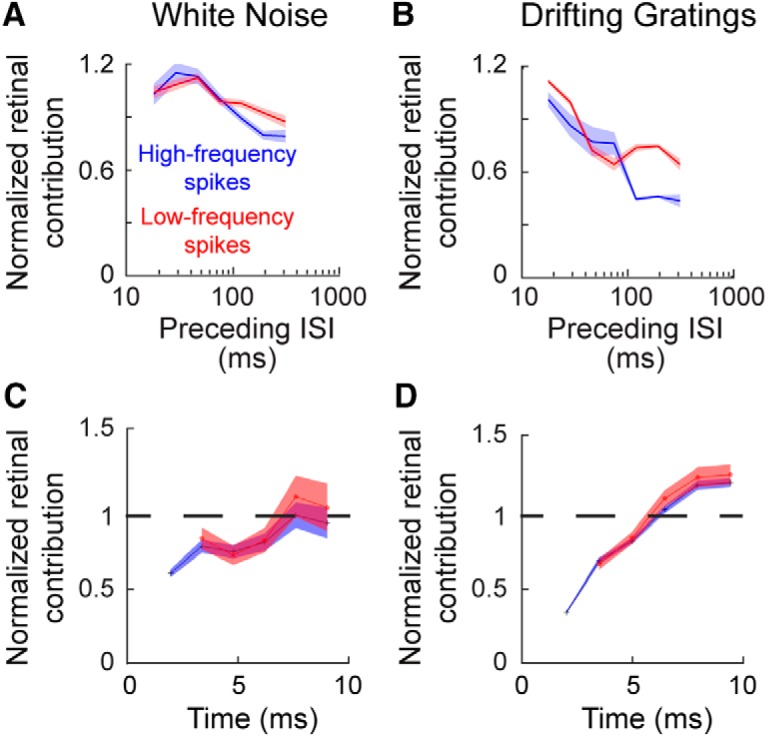
The influence of a preceding LGN ISI on retinal contribution. A, B, Line plot showing the influence of a preceding LGN ISI on retinal spike contribution (red line, low-frequency spikes, subsequent ISI of >4 ms; blue line, high-frequency spikes, subsequent ISI of ≤4 ms). Shaded area indicates SE. C, D, Line plots showing the temporal duration of the influence shown in A and B. Time = 0 is set as the occurrence of the initial spike following the referenced ISI (e.g., time of the cardinal spike in a burst).