
Figure 6.
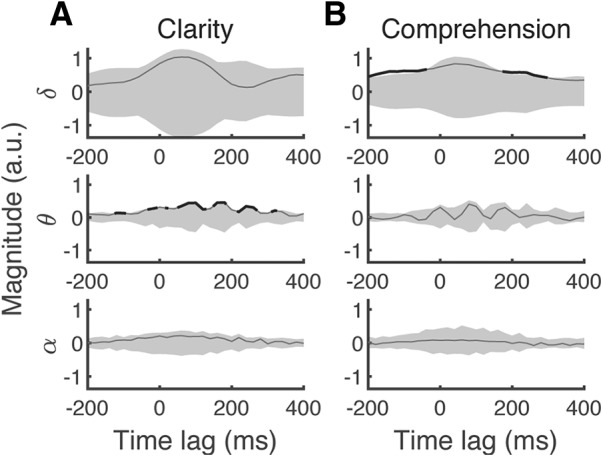
Contribution of the cortical speech tracking at different latencies to speech clarity and comprehension. The population averages (black lines) of the coefficients of the forward model predicting neural entrainment from clarity (A) or from comprehension (B) are compared with the null distribution obtained by shuffling the clarity respectively comprehension values (gray shading, two-tailed, p = 0.05, FDR corrected over time lags). Latencies at which the coefficients of the forward model reach statistical significance are indicated through a bold line. A, Clarity relates to the neural entrainment in theta band at a delay of 160 ms. B, Comprehension modulates delta band entrainment at −100 and 240 ms.