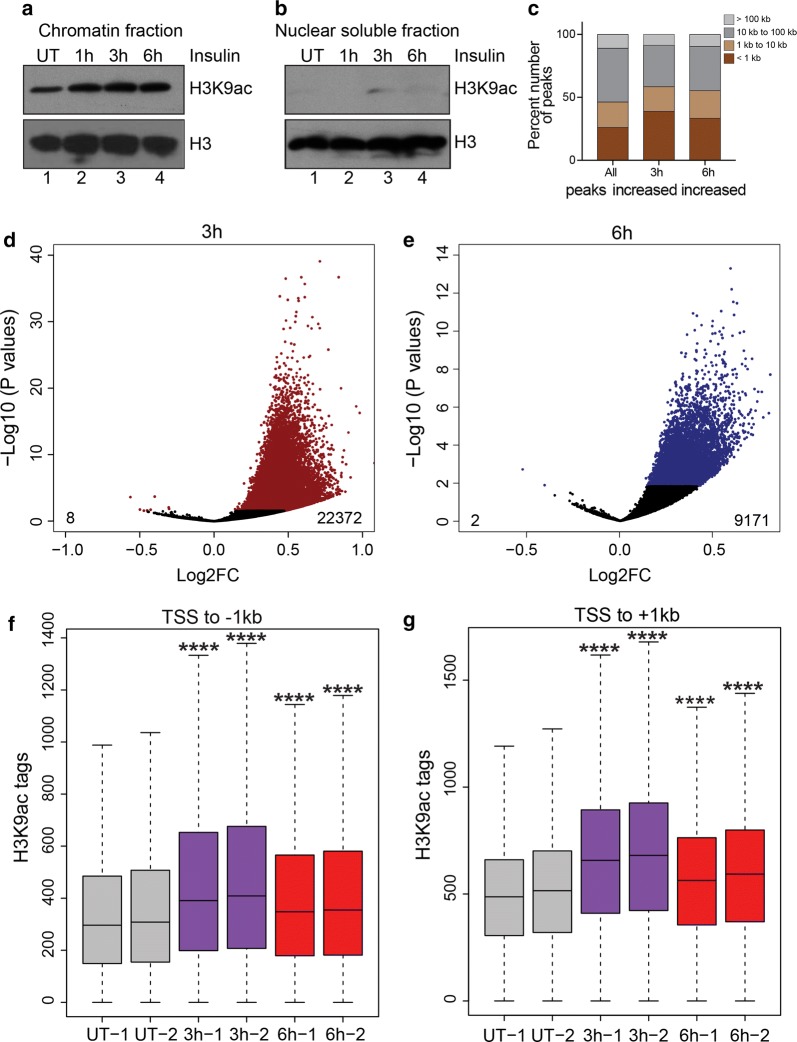
Fig. 3.
Insulin induces H3K9 acetylation on promoter regions. a Western blot analysis for H3K9ac in chromatin fraction or b nuclear soluble fraction (right panel) extracted from insulin-treated cells. c Stacked bars showing the distribution of H3K9ac peaks categorized by distance to nearest transcription start site (TSS). d Volcano plot showing the 22,372 peaks that increased and 8 peaks that decreased H3K9ac acetylation after 3 h insulin treatment. e Volcano plot showing the 9171 peaks that increased and 2 peaks that decreased H3K9ac acetylation after 6 h insulin treatment. f Box plots showing the distribution of peak scores at − 1 kb to TSS regions of significantly increased H3K9ac peaks. g Box plots showing the distribution of peak scores at TSS to + 1-kb regions of significantly increased H3K9ac peaks. Significance was calculated using Kruskal–Wallis test followed by Dunn’s multiple comparisons test. Adjusted p values were calculated using Benjamini–Hochberg method. ****p < 0.0001

