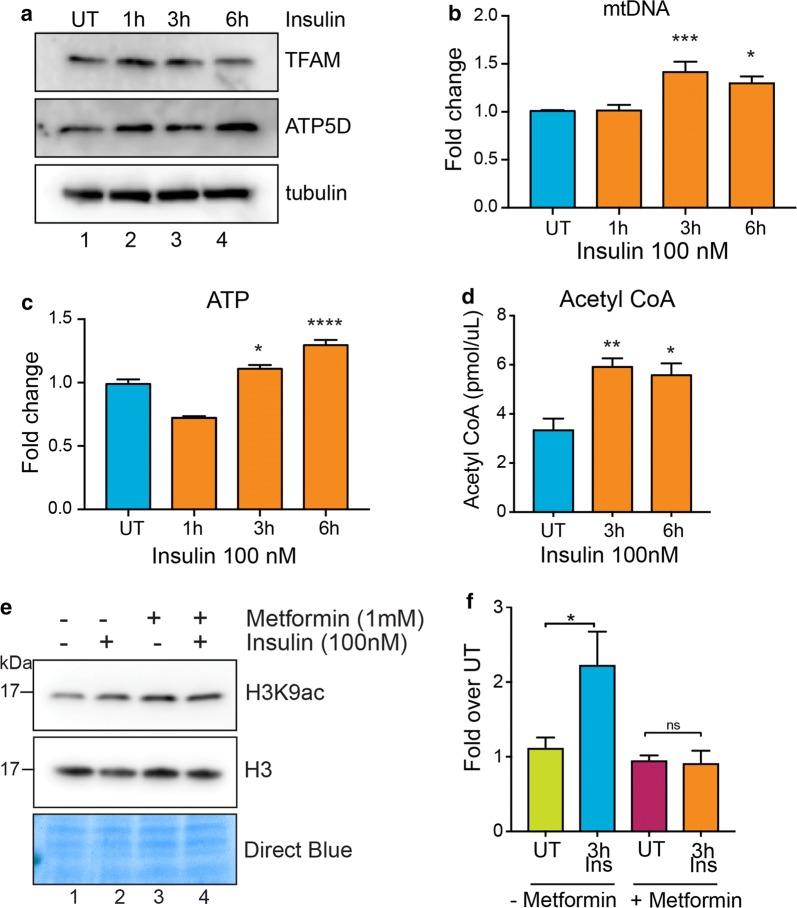
Fig. 6.
Insulin increases mitochondrial biogenesis and ATP production. a Western blot analysis using the indicated antibodies in MDA-MB-231 cell lysates treated with insulin (100 nM) for 1 h, 3 h or 6 h. b Bars show fold change in mitochondrial DNA content and c ATP levels in MDA-MB-231 cells treated with insulin (100 nM) for 1 h, 3 h or 6 h. d Acetyl-CoA levels in MDA-MB-231 cells treated with insulin (100 nM) for 3 h or 6 h. e Western blot analysis using H3K9ac antibody in MDA-MB-231 cells pretreated (lanes 3 and 4) or not (lanes 1 and 2) with 1 mM metformin (24 h) followed by insulin treatment for 6 h. f Densitometric quantification of H3K9ac/H3 western blot signals in (e). Data are represented as fold change to respective UT. b–d, f Values are Mean + SEM from three independent experiments. Statistical significance was calculated using one-way ANOVA, b–d Dunnett’s multiple comparisons test and f Tukey’s multiple comparisons test. *p < 0.05, **p < 0.01, ***p < 0.001, ****p < 0.0001, ns = nonsignificant

