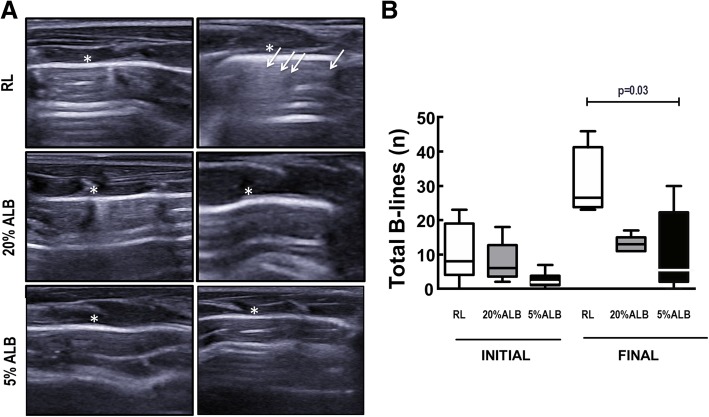
Fig. 2.
Lung ultrasound and B-lines. a: RL, Ringer’s lactate; ALB, albumin. B-lines (white arrows) are visible as coherent echoic bundles with a narrow base, spreading from the pleural line to the edge of the screen without fading. * Pleura. b: Boxes show the interquartile range (25th–75th percentile), while whiskers encompass the range (minimum-maximum) and horizontal lines represent the median in 6 animals/group. The Kruskal–Wallis test was used to compare groups at INITIAL and FINAL

