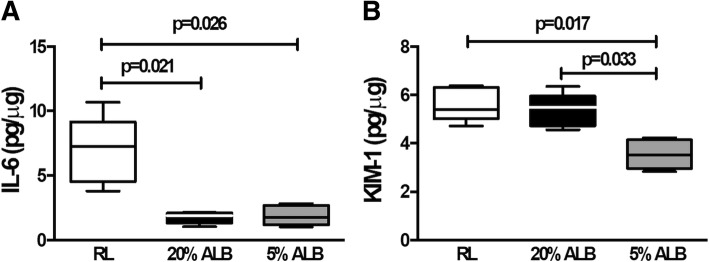
Fig. 6.
Protein levels of interleukin (IL)-6 in lung tissue (a) and kidney injury molecule (KIM)-1 in kidney tissue (b). Boxes show the interquartile range (25th–75th percentile), while whiskers encompass the range (minimum-maximum) and horizontal lines represent the median in 5 animals/group. Comparisons among all groups were done by the Kruskal–Wallis test followed by Dunn’s test (p < 0.05)

