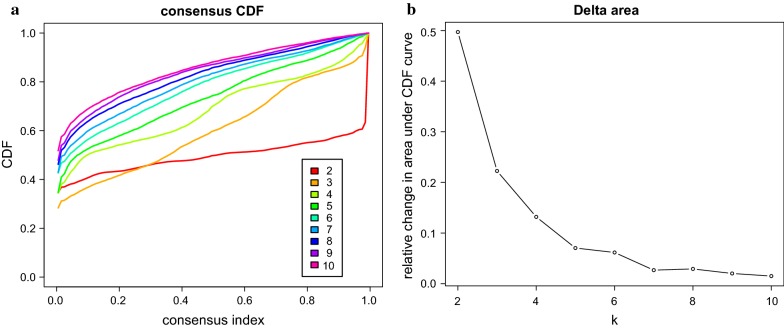
Fig. 1.
Consensus clustering of RCC distinct DNA methylation prognostic subgroups. a CDF curve. b CDF Delta area curve. Delta area curve of consensus clustering, indicating the relative change in area under the cumulative distribution function (CDF) curve for each category number k compared with k-1. The horizontal axis represents the category number k and the vertical axis represents the relative change in area under CDF curve

