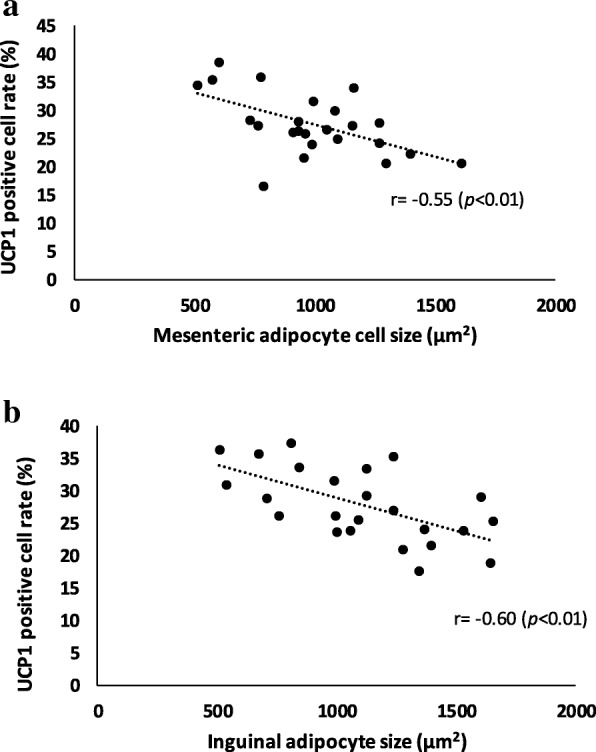
Fig. 7.

Correlation between UCP1 positive cell ratio (%) and white adipocyte size. The correlation between adipocyte size and UCP1 positive ratio (n = 8, each group) was determined in mesenteric (a) and inguinal (b) adipose tissue, respectively. Negative correlations were found between the adipocyte size and the proportion of UCP1 positive cells in both mesenteric and inguinal adipose tissue (Pearson correlation coefficients r = − 0.55, r = − 0.60, respectively). Values show statistical significance (7a and 7b; p < 0.01) (n = 8). UCP1: uncoupling protein 1
