
Figure 1.
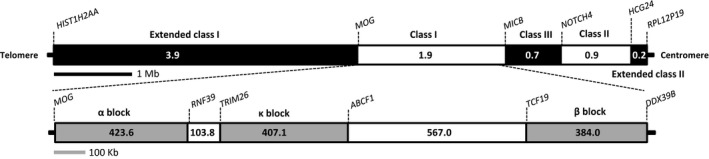
Simplified map of the human MHC (upper) and MHC class I (lower) regions. The MHC was drawn according to Horton et al. (2004). Both regions are drawn to scale. The α duplication lies between the MOG (myelin oligodendrocyte glycoprotein) and RNF39 (RING finger protein 39) genes, the κ duplication block between TRIM26 (tripartite motif containing 26) and ABCF1 (ATP‐binding cassette subfamily F member 1), and the β duplication block between TCF19 (transcription factor 19) and MICB/BAT1