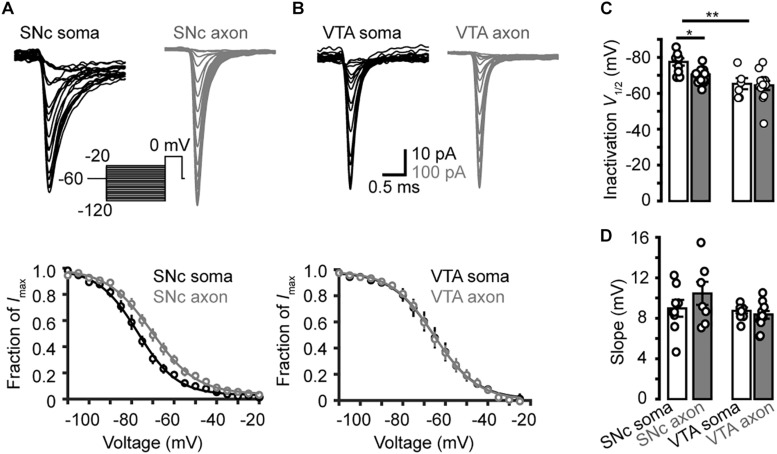
FIGURE 6.
Steady-state inactivation of transient Na+ currents in midbrain TH neurons. (A) Example families of Na+ currents (top) evoked by the voltage commands (inset) for steady-state channel inactivation in a SNc somatic nucleated patch and an isolated AIS bleb. Bottom, inactivation curves of SNc Na+ currents (n = 7 somatic nucleated patches and 7 isolated AIS blebs). (B) Similar as in A but from VTA cells. (C,D) Group data comparing the half-inactivation voltages and the inactivation curve slopes. *p < 0.05; ∗∗p < 0.01.

