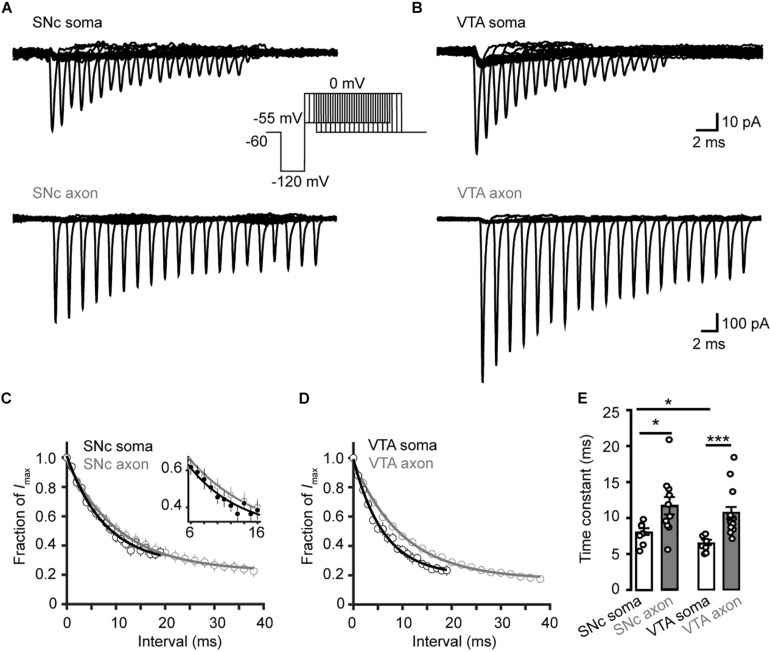
FIGURE 7.
Time course of Na+ channel inactivation onset in TH neurons. (A) Example currents evoked by the voltage commands (inset) in SNc neurons. The Vm was stepped from a prepulse of –120 mV (20 ms) to –55 mV with varying intervals followed by a test pulse to 0 mV (5 ms). (B) Similar as in A but from VTA neurons. (C,D) Plots of the currents as a function of intervals. Currents were normalized to the Na+ currents without time interval. The plots were fitted with single exponential functions. Inset, expanded plots showing differences between the two groups. (E) Time constants for the development of Na+ channel inactivation at –55 mV. *p < 0.05; ∗∗∗p < 0.001.

