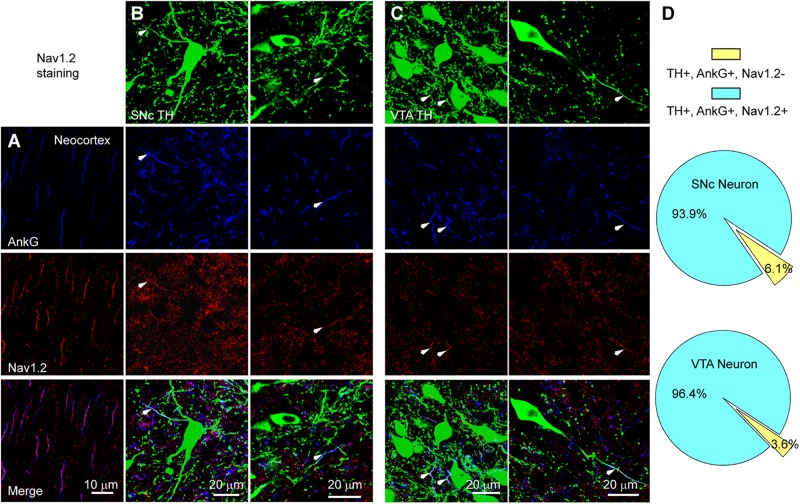
FIGURE 9.
The AIS of midbrain TH-positive neurons express Nav1.2. (A) Double staining of AnkG (Blue) and Nav1.2 (Red) in neocortex. (B) Triple staining of TH (green), AnkG (Blue) and Nav1.2 (Red) in two example SNc cells. White arrowheads indicate neurite segments positive to all three antibodies. (C) Similar as in B but for cells in VTA. (D) Percentages of TH/AnkG-positive neurites in SNc (top) and VTA (bottom) that are positive (blue) or negative (yellow) to Nav1.2 staining.

