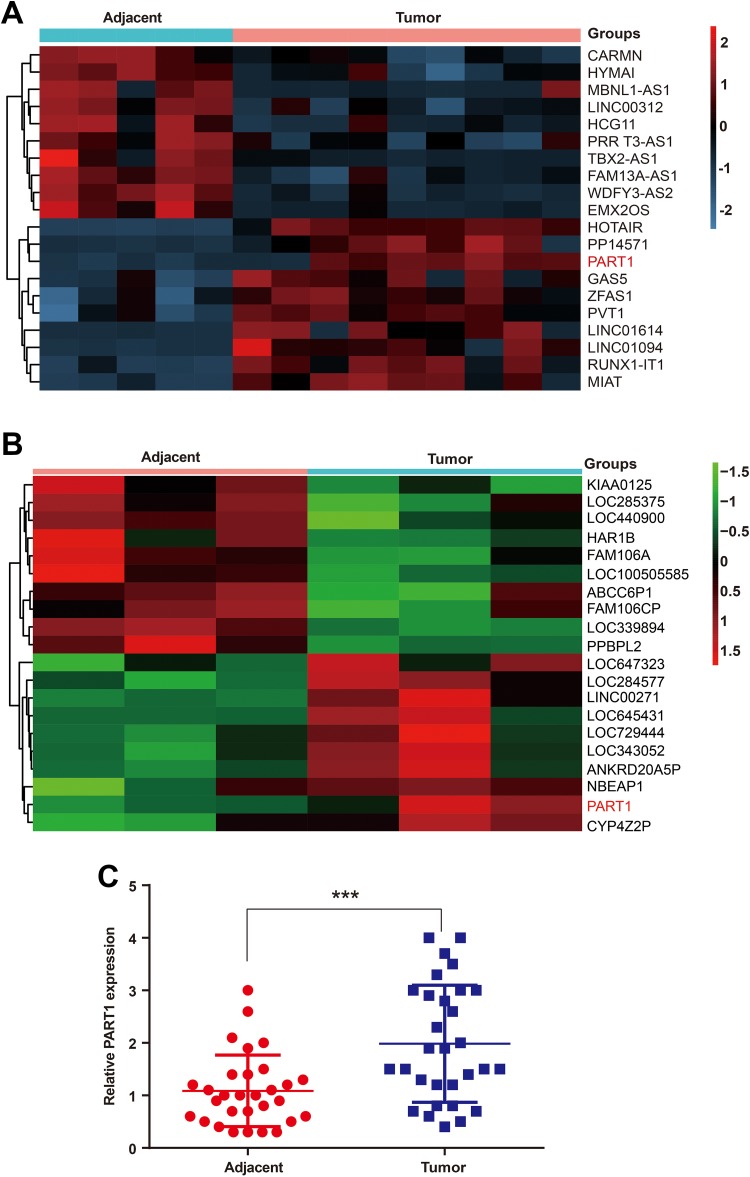
Figure 1.
The long noncoding RNA PART1 is overexpressed in bladder cancer. (A) The heatmap represents unsupervised hierarchical clustering of lncRNA expression in bladder cancer tissues compared with adjacent nontumor tissues. Each column represents the indicated tissue sample, and each row indicates one lncRNA. The red color scale represents higher expression levels, and the blue color scale represents lower expression levels. (B) The heatmap of the 20 differentially expressed lncRNAs from the GEO microarray GSE100926. PART1 is upregulated in bladder cancer (|fold changes|>2, p.value<0.05). The red color scale represents higher expression levels, and the green color scale represents lower expression levels. (C) The relative PART1 expression levels were determined using qRT-PCR in 30 samples of bladder cancer tissues. PART1 is upregulated in bladder cancer tissues. (***p<0.001). lncRNAs indicates long noncoding RNAs

