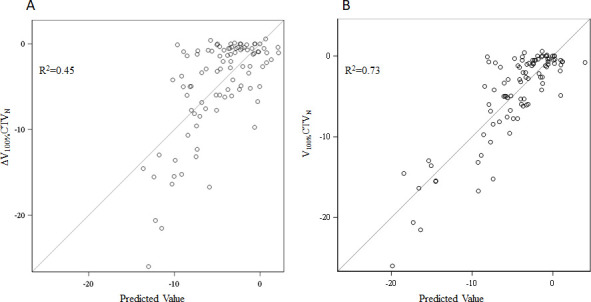
Figure 2.

Stepwise regression models to estimate undercovering nodal clinical target volumes. The graphs indicate the model’s predicted value of the change in nodal coverage (ΔV100%CTVN) on the x-axis, versus the actual value of V100%CTVN on the y-axis. The model evaluated on the left (A) is a standard linear regression model, whereas the model evaluated on the right (B) accounts for higher-order interactions.
