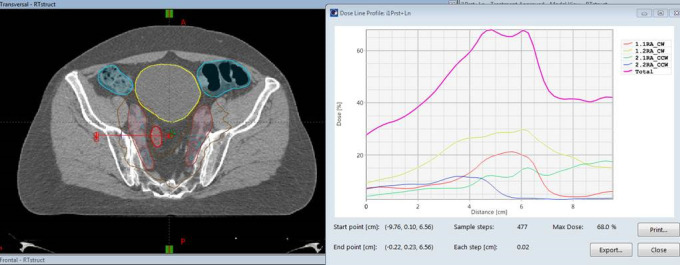
Figure 3.

Representative planning CT with dose distribution (left) and the corresponding axial dose gradient (right). A shift of this dose distribution to the patient’s left (as indicated by the large red arrow) would lead to a sharp decrease in the dose over the span of a few millimeters, whereas a shift to the patient’s right would not cause a sharp decrease in the dose. In this case, the sharp dose gradient was designed to spare a loop of small bowel (outline in crimson) immediately adjacent to the nodal contour.
