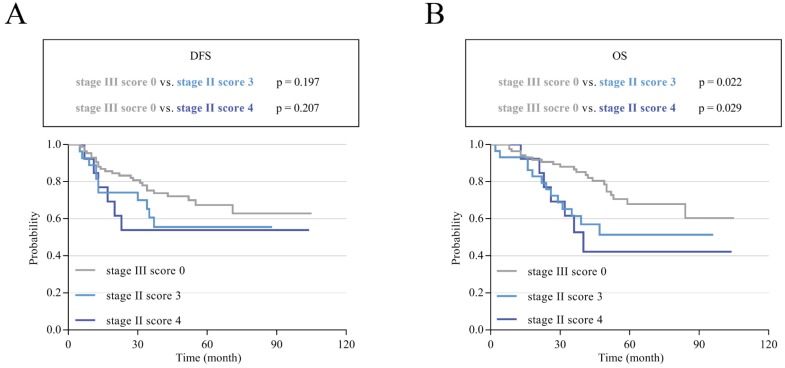
Figure 4.
K-M survival curves in stage III CRC patients with a score of 0 and stage II patients with scores of 3 and 4. (A) K-M curves of DFS comparing patients with stage III tumors and a score of 0 with patients with stage II tumors and scores of 3 and 4. (B) K-M curves of OS comparing patients with stage III tumors and a score of 0 with patients with stage II tumors and scores of 3 and 4.

