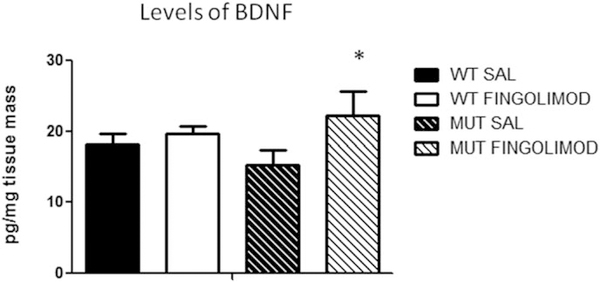
Fig. 2.
ELISA measuring levels of endogenous BDNF in the PFC across both genotype and treatment groups. Dysbindin-1 MUT mice (n = 8) showed slightly lower levels of BDNF in the PFC compared with their WT counterparts (n = 7) and a significant increase (n = 9; paired t-test, ★P < 0.022) after fingolimod treatment. SAL, saline.

