Figure 1.
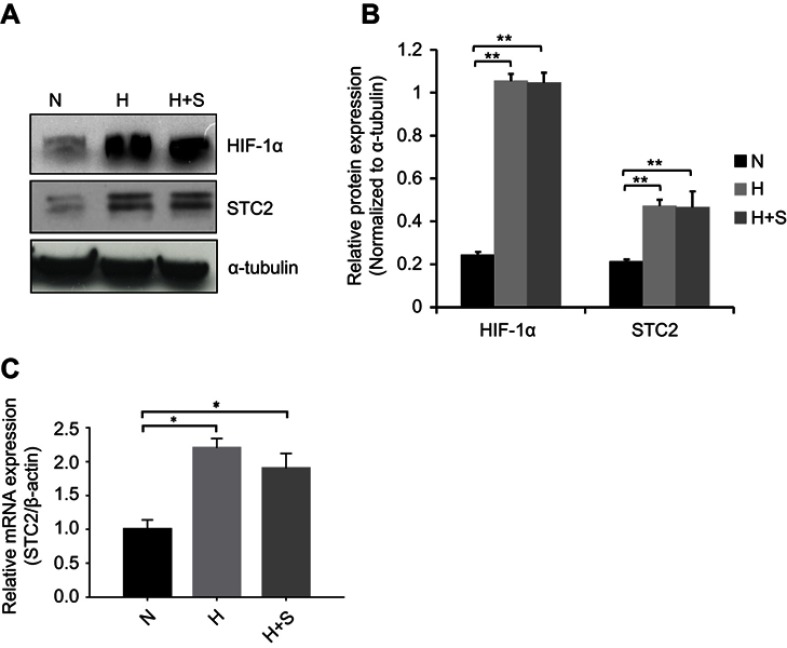
Metabolic stress upregulates STC2 expression in CNE2 cells.
Notes: CNE2 cells were cultured under hypoxia (H) or combined hypoxia and glucose starvation (H+S) conditions for 16 hrs. (A) Whole cell lysates were prepared, and Western blotting was used to determine the levels of STC2. HIF-1α was examined as indicator of hypoxia, and α-tubulin was determined as loading control. (B) Three independent Western blots performed under the identical experimental conditions, and results were quantified based on signal density. Error bars are mean± SD(n=3). **P<0.01. (C) Total RNA was extracted, and mRNA levels of STC2 were determined by quantitative real-time PCR after reverse transcription. *P<0.05.
Abbreviations: N, normal culture condition (21% O2, 25 mM glucose); H, hypoxia (1% oxygen); H+S, hypoxia (1% oxygen) and glucose starvation (2.5 mM).

