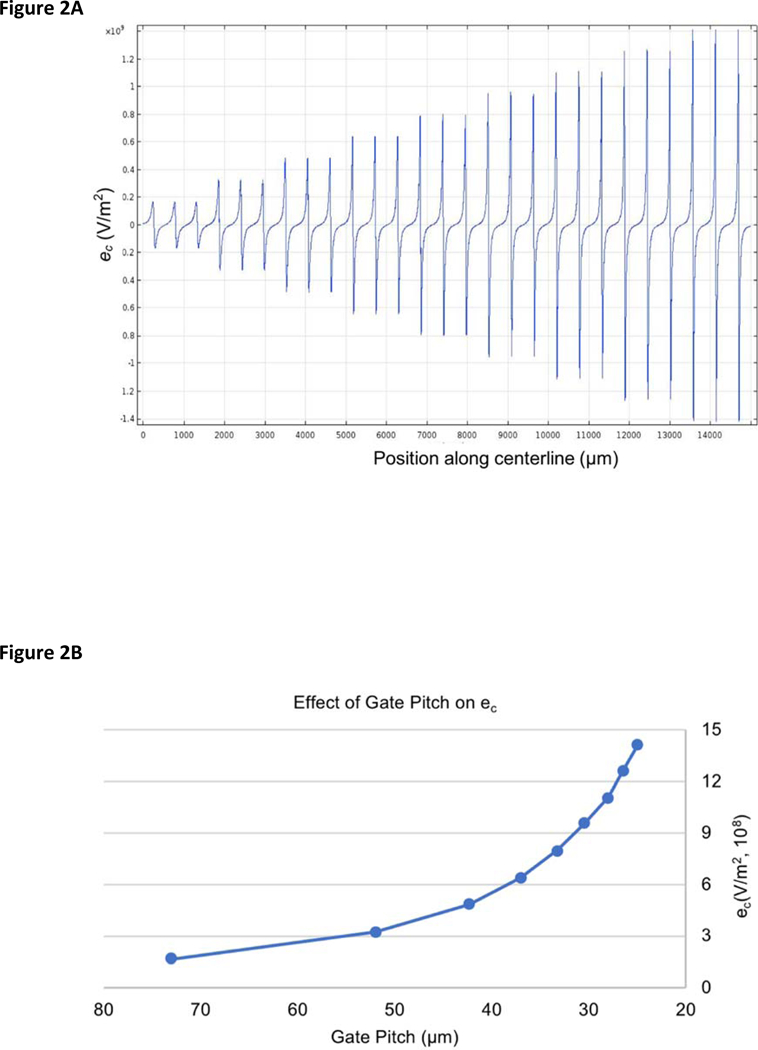
Fig. 2.

Calculated (ec) values in the DC-iDEP device. (A) ec intensity along centerline (see Figure 1) in the microchannel. Position along centerline started from the beginning of the sawtooth design to the end of the last (narrowest) gate. Peak-valley pairs correspond to ec value distributions about each gate. The ec value was positive on the left side of the gate tip and negative on the right side of the gate tip. (B) Effect of gate pitch on ec. Values increase as gate pitch size decreases from the inlet to the outlet in the microchannel. The voltage is modeled at 90 V applied global voltage.
