
Fig. 3.
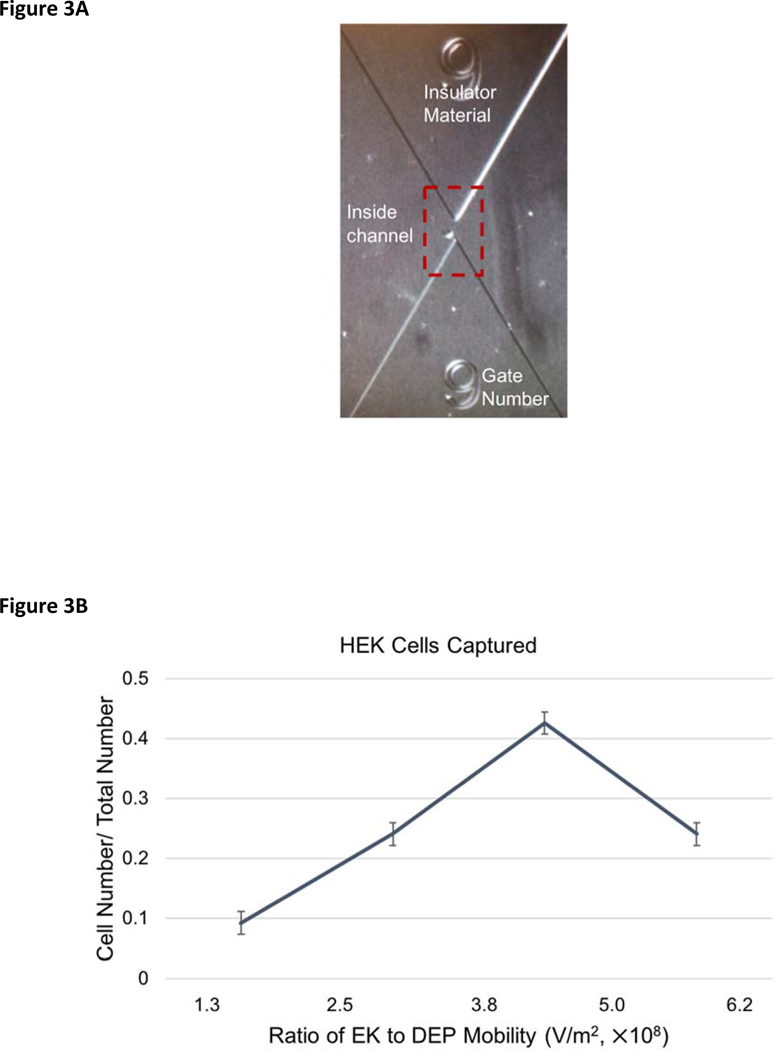
DC-iDEP behavior of HEK 293 cells. (A) Image of an HEK cell captured at gate 9. (B) HEK cell abundance within each EKMr bin. HEK cells were captured with an EKMr range of 1.3 × 10⁸ – 6.2 × 10⁸ V/m2 with an average of 4.2 × 10⁸ V/m2. The voltage applied was 70 V. All error bars represent SEM.