
Figure 3.
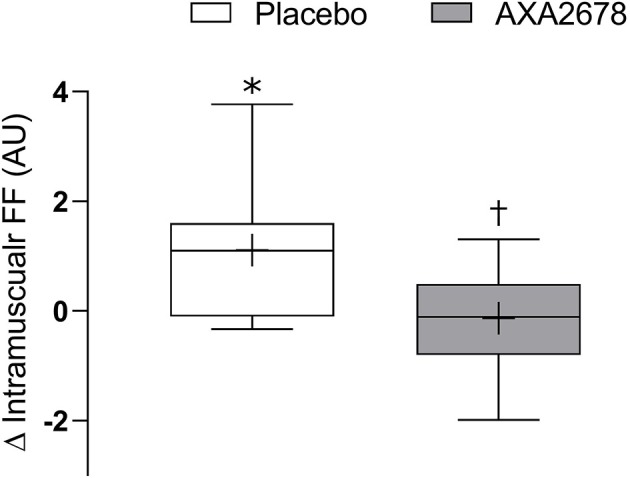
Change in muscle fat fraction (FF) during immobilization (d8–d15). Data are presented as median (lines) with interquartile range (boxes) ± range (minimum and maximum), where + indicates the group mean. *Signficantly different from zero (p < 0.05). †signficantly different from PL (p < 0.05).