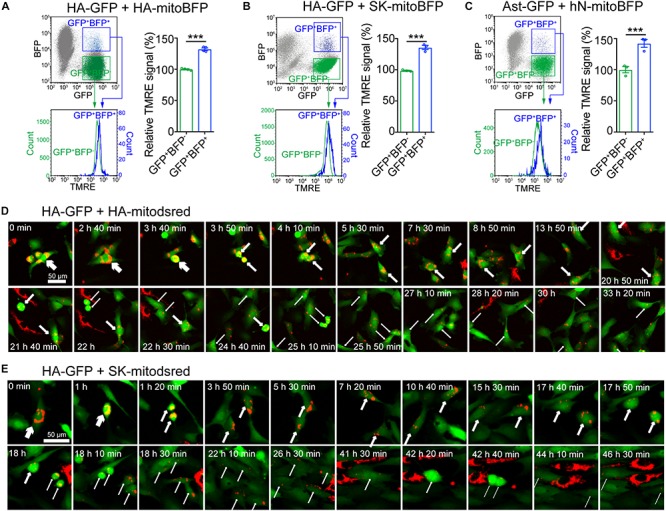
FIGURE 5.

Elevation of mitochondrial membrane potential (MMP) in cells with transferred mitochondria (A–C) Measurement of MMP on co-cultured HA-GFP and HA-mitoBFP (A), HA-GFP and SK-mitoBFP (B), and Ast-GFP and hN-mitoBFP (C) by TMRE staining. TMRE signal intensity was compared between gated GFP+BFP+ and GFP+BFP– cells. (D,E) Time-lapse live images showing the dynamics of mitochondria transferred from HA-mitodsred (D) or from SK-mitodsred (E) into HA-GFP along cell division. Data are represented as mean ± SEM. P values in A, B, C calculated with two-tailed student t test were <0.001. ∗∗∗p < 0.001.
