Figure 6.
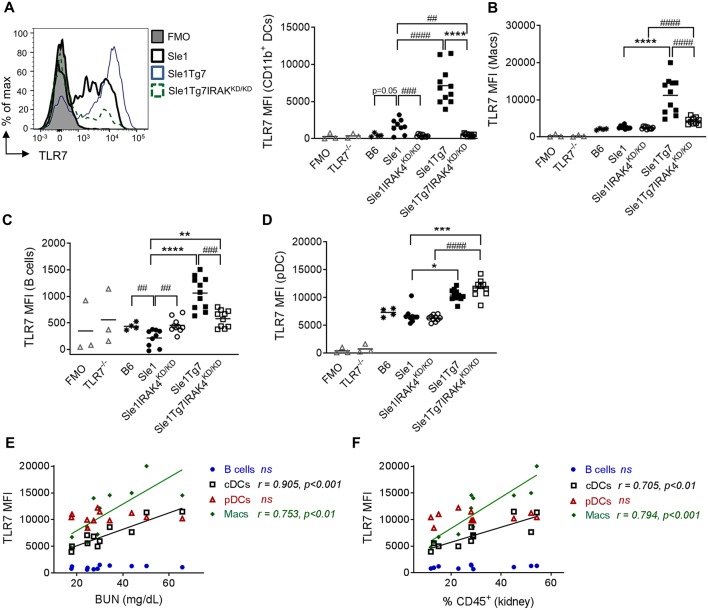
Expression of leukocytes in the kidney is modulated by disease and Tg7 transgene. Leukocytes in the kidney from 6 to 7 months old B6, Sle1, Sle1IRAK4KD/KD, Sle1Tg7, and Sle1Tg7IRAK4KD/KD female mice were analyzed for intracellular TLR7 expression using flow cytometry. TLR7−/− mice and fluorescent minus one (FMO) controls were used to determine specificity. (A) Representative overlay plots of intracellular TLR7 expression in CD11b+ DCs showing increases due to the transgenic and severe disease factors with cumulative data across all strains. Cumulative intracellular TLR7 protein expression in (B) CD11b+CD11c+F4/80+ macrophages (Macs), (C) B cells, (D) pDCs, (E,F) Correlation of TLR7 expression on B cells, CD11b+DCs (cDCs), pDCs, and macrophages (Macs) from Sle1Tg7 mice with (H) BUN and (I) percent of CD45 infiltration in kidney. Data from 9 to 11 mice per group is shown. Parametric data were assessed by 1-way ANOVA (with Bonferroni's multiple comparisons test) and non-parametric data with Kruskal-Wallis (with Dunn's multiple comparisons test) **P < 0.01, ***P < 0.001, ****P < 0.0001. Additional comparisons between two groups were made with a Student's t test or Mann-Whitney test for parametric and non-parametric data, respectively, indicated by # (##P < 0.01, ###P < 0.001, ####P < 0.0001). Correlations were performed by calculating Pearson's correlation coefficients (r) and their significance assessed by a two-tailed t-test.

